
Figure 3.
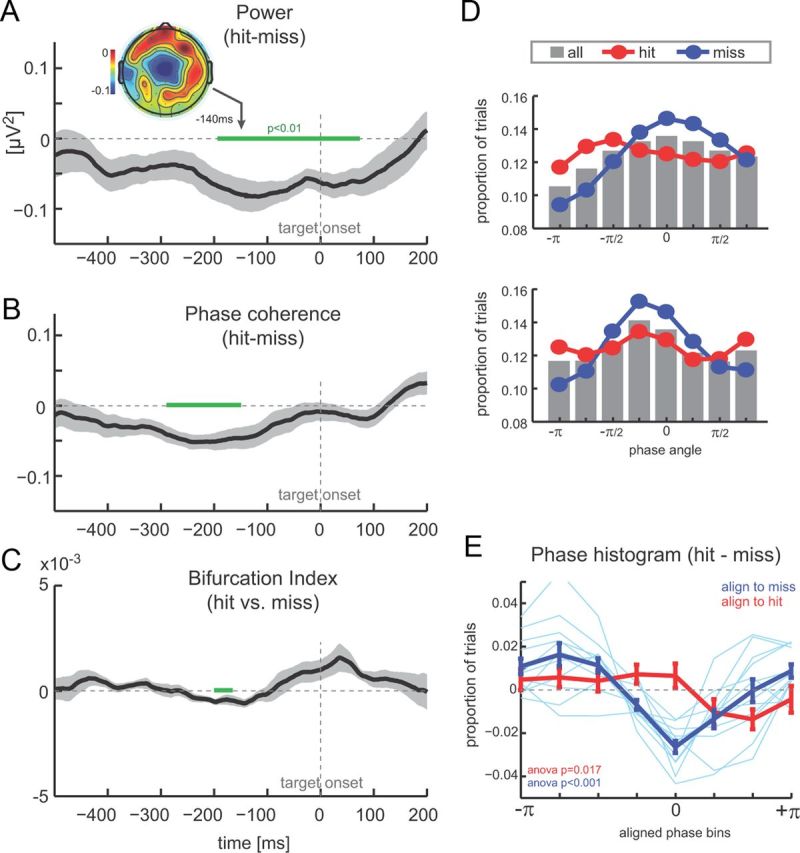
Pre-target oscillations and detection performance. A, Difference between hit and miss trials in theta band (2–6 Hz) power (n = 12, mean ± SEM). Negative values indicate higher power during miss trials. Time 0 corresponds to target onset, and green bars delineate epochs with a significant difference between hit and miss trials (paired t test, p < 0.01). Inset shows the topography of power difference. B, Difference (hit − miss) in theta band (2–6 Hz) phase coherence. Same conventions as in A. C, Phase bifurcation index (hit vs missed trials). Negative values indicate stronger phase locking in one condition versus the other. D, Example phase histograms from two subjects showing the distribution of phase angles across all trials (gray bars), hit trials (red), and miss trials (blue) at t = −200 ms. E, Difference between phase histograms for hit and miss trials, after histograms were aligned across subjects using the peak of hit (red) or miss (blue) distributions (mean ± SEM). Light blue lines display single-subject data.