
Figure 4.
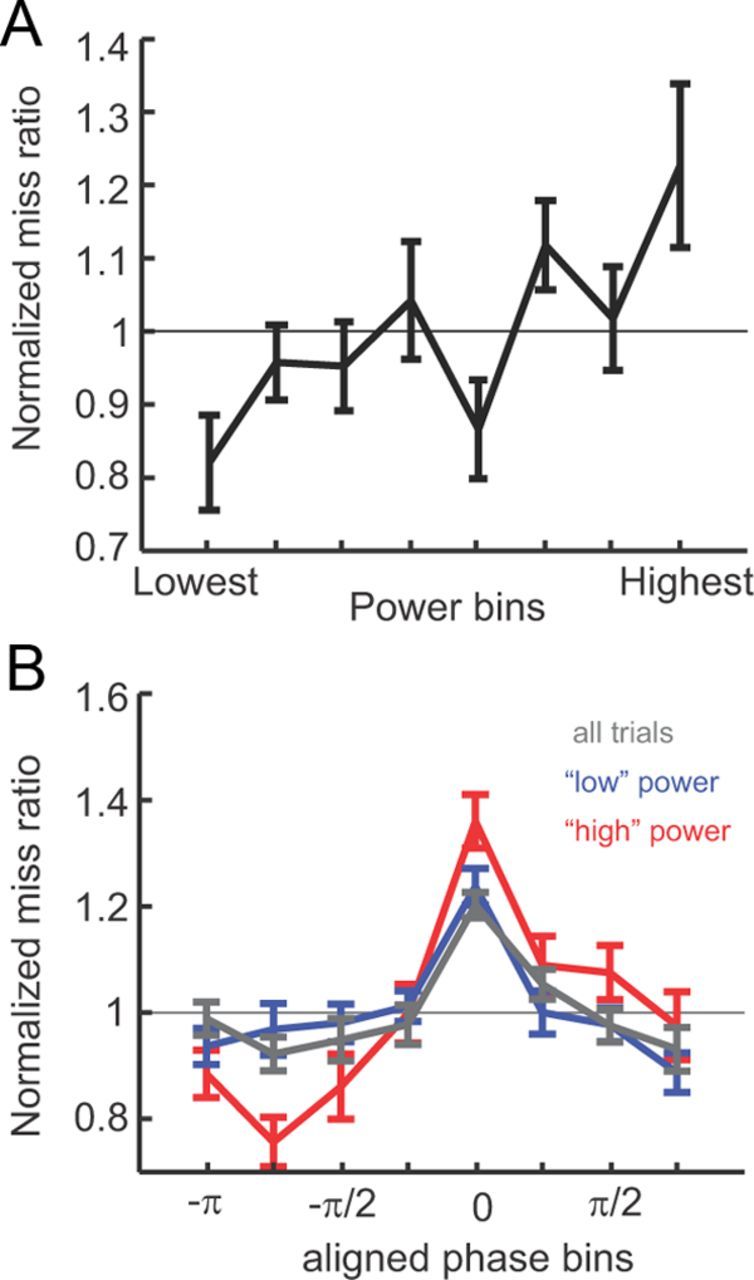
Impact of power and phase on detection rates. A, Miss rate as a function of (binned) power across subjects (mean ± SEM) at the time point when power effects were maximal (t = −132 ms). Histograms are normalized to the mean miss ratio per subject. B, Miss rate as a function of phase at the time point when power effects were maximal (t = −200) for all trials (black) and for “high-power” and “low-power” trials (above or below 50th percentile, red and blue traces respectively). Histograms were aligned across subjects (aligned to bin 0).