
Figure 5.
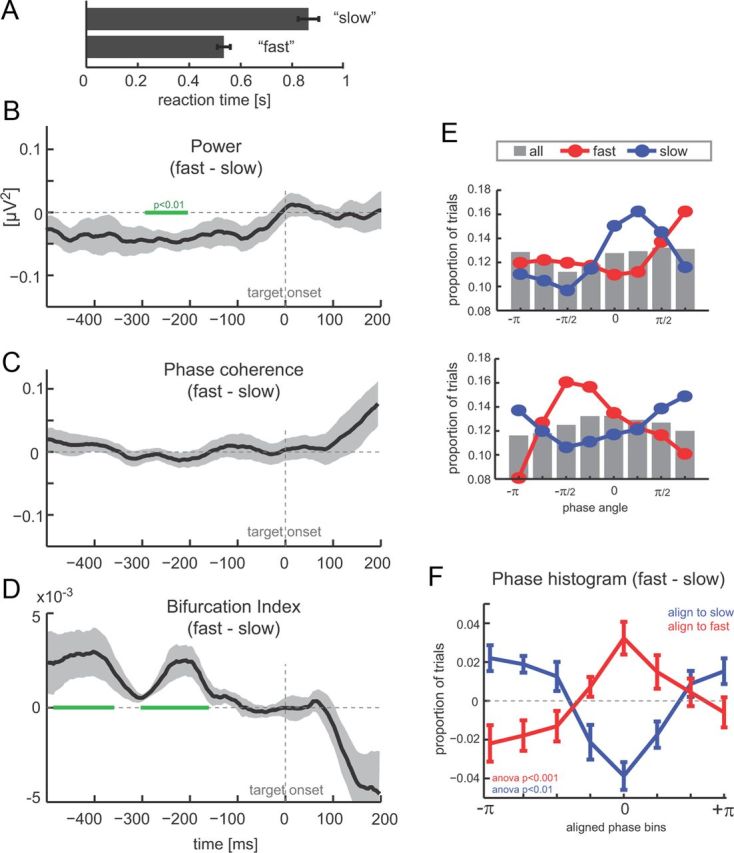
Pre-target oscillations and reaction times. A, Reaction times in “fast” and “slow” hit trials (based on top and bottom 40th percentiles). B, Difference between fast and slow trials in theta-band (2–6 Hz) power (n = 12, mean ± SEM). Time 0 corresponds to target onset, and green bars delineate epochs with a significant difference between hit and miss trials (paired t test, p < 0.01). C, Difference (fast − slow) in theta-band (2–6 Hz) phase coherence. D, Phase bifurcation index (fast vs slow trials). Negative values indicate stronger phase-locking in one condition versus the other. E, Example phase histograms from two subjects showing phase angle distributions over all hit trials (gray bars), fast trials (red), and slow trials (blue) at t = −208 ms. F, Difference between phase histograms for fast and slow trials, after histograms were aligned across subjects using the peak of fast (red) or slow (blue) distributions (mean ± SEM).