
Figure 6.
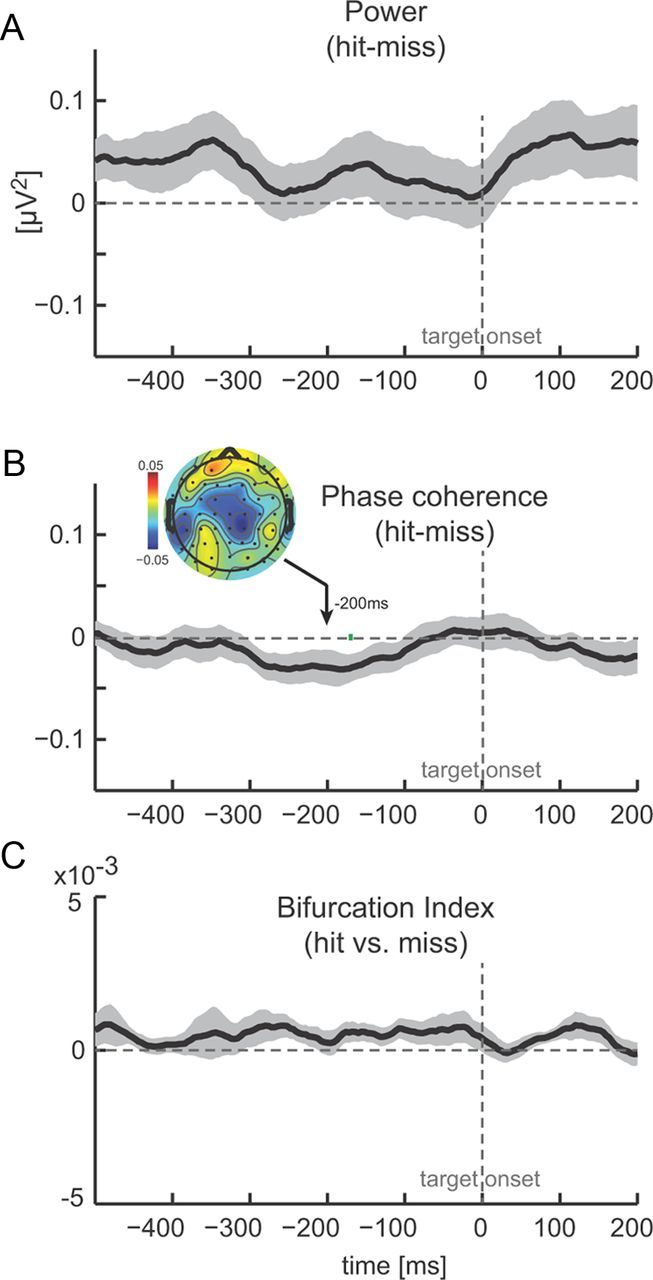
Prestimulus alpha oscillations do not influence detection performance. A, Difference between hit and miss trials in alpha-band (8–12 Hz) power (n = 12, mean ± SEM). Negative values indicate higher power during miss trials. Time 0 corresponds to target onset, and green bars delineate epochs with a significant difference between hit and miss trials (paired t test, p < 0.01). B, Difference (hit − miss) in theta band (2–6 Hz) phase coherence. Same conventions as in A. Inset shows the topography of phase coherence difference. C, Phase bifurcation index (hit vs missed trials).