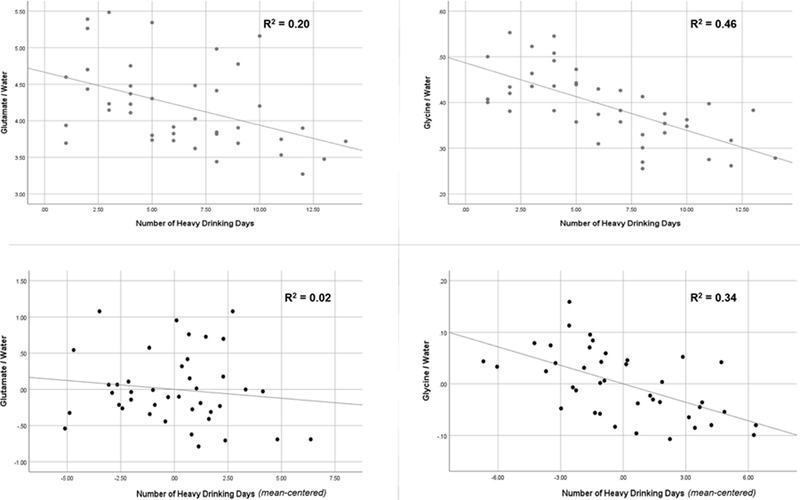
Figure 2.
Associations of glutamate and/or glycine with total number of heavy drinking days (nHDD) within the past 14 days. Top panel = scatterplot and linear fit between a) glutamate and nHDD (left) and b) glycine and nHDD (right). Bottom panel = Partial regression plot and linear fit between a) glutamate and nHDD, controlling for glycine (left) and b) between glycine and nHDD, controlling for glutamate (right).

