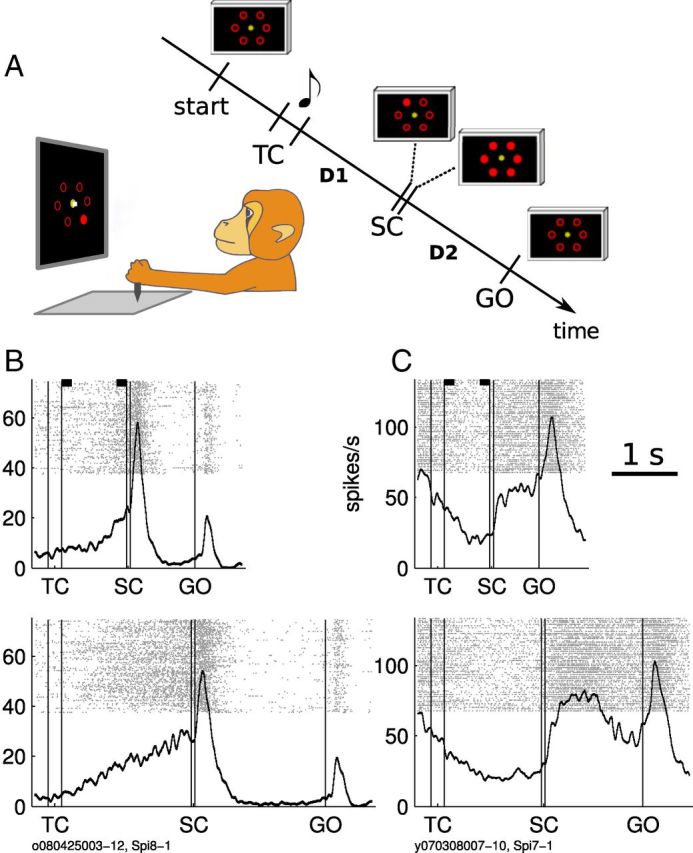
Figure 1.

Behavioral paradigm and activity of two representative neurons. A, Left, Drawing of the experimental apparatus showing the SC epoch (note the cursor on the central fixation dot). Right, Sequence of task events, not to scale. Start indicates the moment when the monkey brings the cursor to the center of the screen to initiate a new trial. The note indicates the presentation of a tone. Tone pitch differs according to delay duration. All screen-shots shown in the diagram stay on until the next one appears (cursor is not shown). TC, 200 ms; SC, 55 ms; D1, delay 1, D2, delay 2. Both delays have either short duration (700 ms in monkey T and 1000 ms in monkey M) or long duration (1500 ms in monkey T and 2000 ms in monkey M). There is also a 700 ms delay between start and TC. B, C, Raster plots and PETHs of two neurons (left and right). Top, Short-delay trials; bottom, long-delay trials. All movement directions included. In the raster plots, each dot is an action potential and each row a trial, ordered in chronological order of recording from bottom to top. The thick black lines represent the neuronal activity averaged across all trials and movement directions. The black rectangles on top of each raster display indicate the analysis windows used to classify neurons (see Results).
