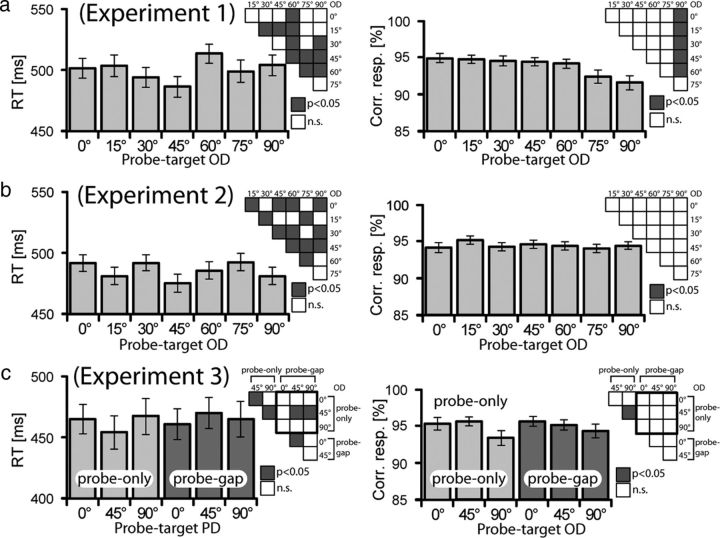
Figure 2.
Behavioral performance of experiment 1 (a), experiment 2 (b), and experiment 3 (c). a, b, Mean RT (left) and proportion (percentage) of correct responses (right) are shown separately for the seven different probe-target orientation differences (probe-target ODs: 0°, 15°, 30°, 45°, 60°, 75°, and 90°). The vertical lines show the SEM. The matrix chart to the top right of each bar graph summarizes the results of corresponding pairwise statistical comparisons (t tests) between OD conditions. Gray indexes significant (p < 0.05, Bonferroni's corrected for multiple comparisons) differences. n.s., Not significant. c, Mean RT (left) and percentage correct responses (right) of the three probe-target orientation differences of experiment 3. Performance data are shown separately for probe-only (bright gray) and probe-gap (dark gray) trials. The charts to the right show the results of corresponding pairwise comparisons of OD conditions between probe-only and probe-gap trials (squares within the bold frame), as well as within probe-only and probe-gap trials (squares flanking the bold frame).

