Figure 3.
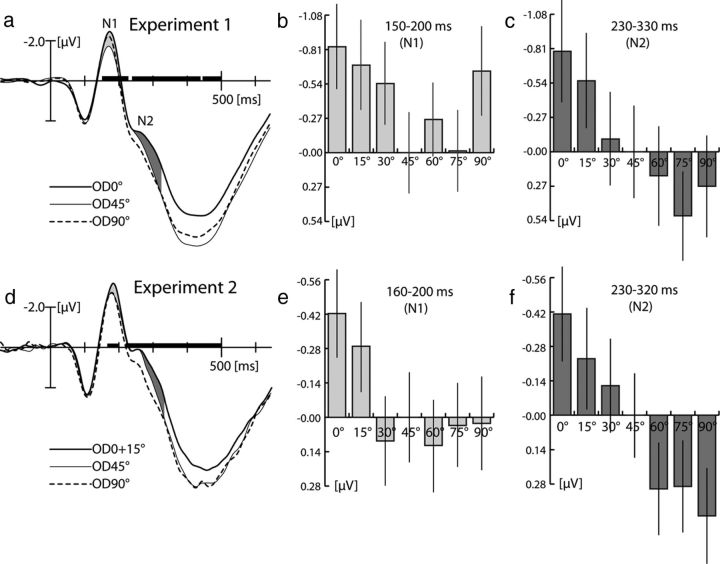
Average ERP waveforms (average across subjects) and amplitude measures of experiment 1 (a–c) and experiment 2 (d–f). a, Waveforms of the OD0° (solid thick line), OD45° (solid thin line), and OD90° (dashed line) conditions recorded from a left parietal–occipital electrode showing maximum effect size (PO7) in experiment 1. Amplitude effects reflecting global FBA in the N1 and N2 time range are highlighted by the bright and dark gray areas between curves, respectively. The black horizontal bars index periods of significant amplitude differences (p < 0.05, sliding-window F test). The bar plots on the right show mean amplitude measures of all OD conditions in the N1 (b) and N2 (c) time ranges. Data are referenced to the amplitude of the OD45° condition. The vertical lines show the SEM. d shows average ERP waveforms from electrode site PO9 showing maximum effect size in experiment 2. Modulation effects reflecting global FBA are highlighted in light gray (N1 time range) and dark gray (N2 time range). The bar plots on the right show corresponding mean amplitude measures (again referenced to the OD45° condition) for the different OD conditions in the N1 (e) and N2 (f) time ranges.

