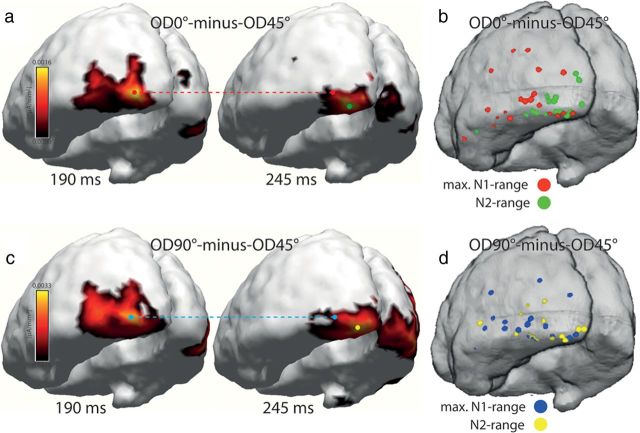
Figure 4.
Source localization results of experiment 1. a, Source-density distributions estimated for the OD0° − OD45° difference of the grand-averaged (over subjects) electromagnetic field response at representative time points in the N1 (190 ms, left) and N2 (245 ms, right) time ranges rendered onto 3D surface segmentations of the MNI brain. The red and green dots index source-density maxima in the early and late time ranges, respectively. The red dashed line highlights the location of the source-density maximum at 190 ms maximum in the 245 ms map. b shows respective source-density maxima (OD0° − OD45° difference) in the N1 (red) and N2 (green) time ranges of each individual subject taking part in experiment 1. c, Source-density estimates of the OD90° − OD45° difference. The blue dashed line highlights the location of the source-density maximum at 190 ms in the 245 ms map. d, Scatter plot of source-density maxima in the N1 (blue) and N2 (yellow) time ranges computed based on individual subject data.

