
Figure 6.
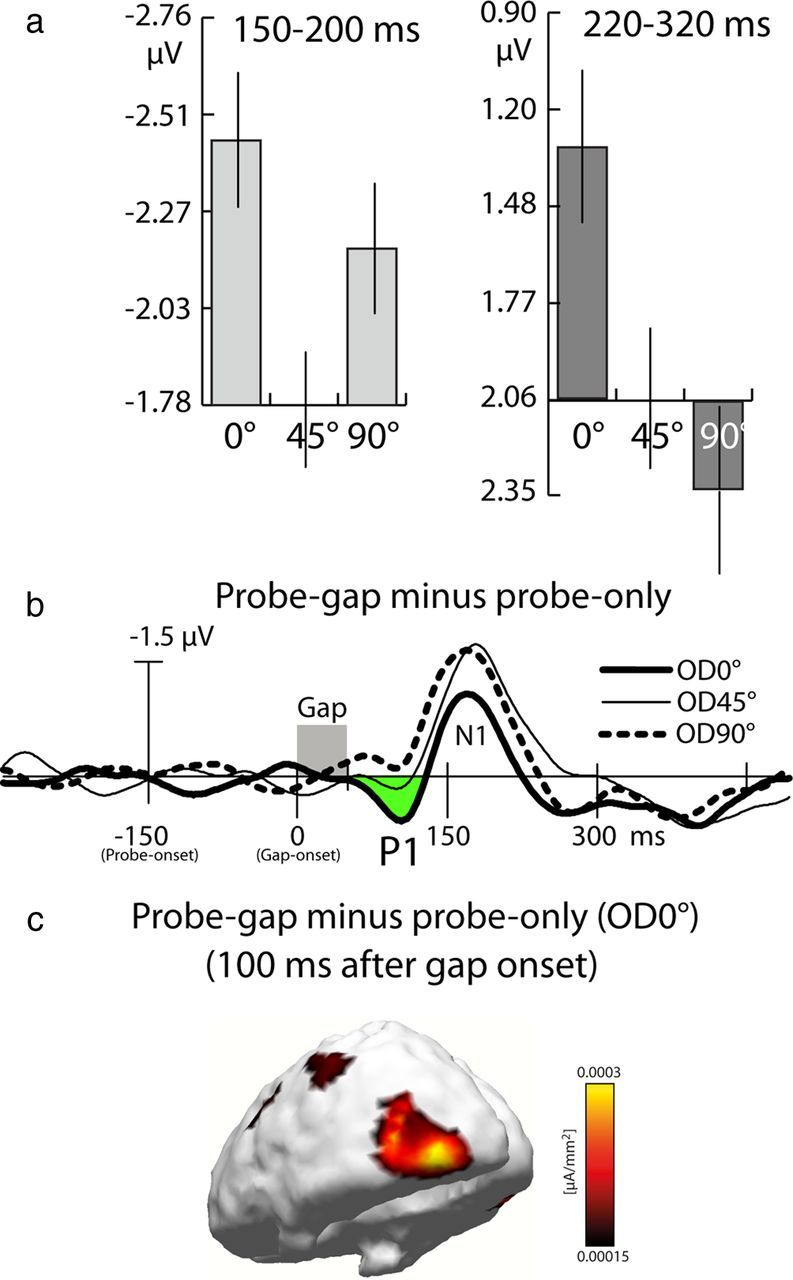
Results of experiment 3. a, Bar plots showing mean amplitude measures of the three OD conditions in the N1 (left) and N2 (right) time ranges at electrode site PO7 showing maximum variation. Data are referenced to the amplitude of the OD45° conditions. The vertical lines show the SEM. b, Difference waveforms (probe-gap − probe-only difference) recorded from P7 showing the gap-elicited response for the three OD conditions. The P1 enhancement of the OD0° condition is highlighted in green. Time point 0 ms refers to the onset of the gap 150 ms after probe onset. c, Distribution of current source-density estimates computed for the grand-averaged P1 effect (probe-gap − probe-only difference) of the OD0° condition 100 ms after gap onset.