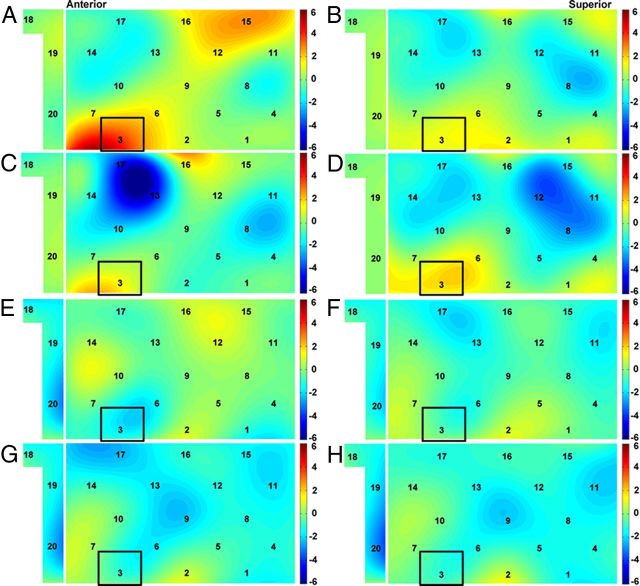
Figure 2.
Neural synchronization increase. t-maps are for the original pairs (A–D), random pairs (E–H), face-to-face dialog (A, E), face-to-face monologue (B, F), back-to-back dialog (C, G), and back-to-back monologue (D, H). The warm and cold colors indicate increases and decreases in neural synchronization, respectively. The black rectangle highlights CH3, showing a significant increase in neural synchronization during the face-to-face dialog.

