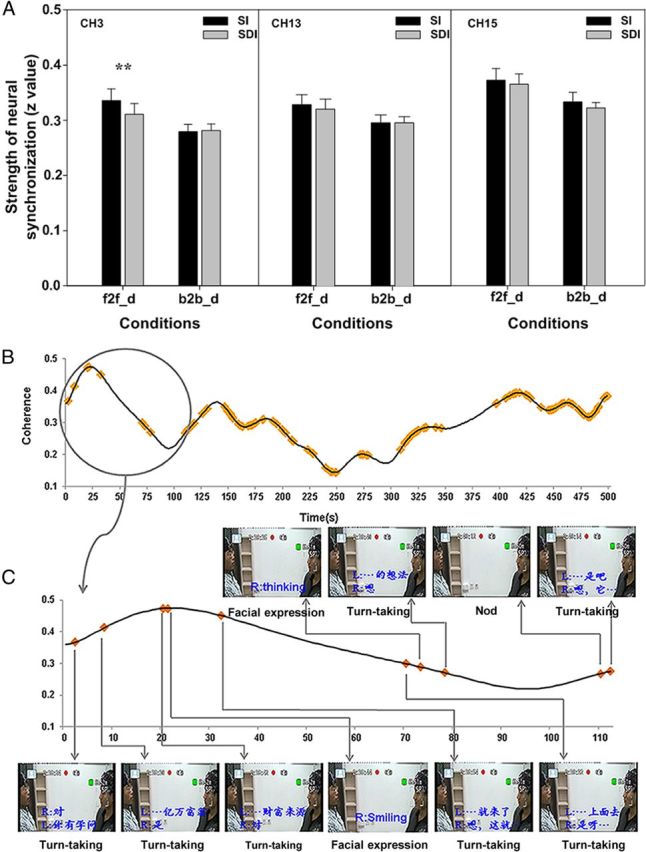
Figure 3.

Contributions of nonverbal cues and turn-taking to the neural synchronization during the face-to-face and back-to-back dialogs. A, Statistical comparisons between SI and SDI. Error bars indicate SE. **p < 0.01. B, Distribution of SI (yellow points) across the entire time course of coherence values in a randomly selected pair of participants. C, A portion of the time course and the corresponding video images recorded during the experiment. The dialog content at that point is transcribed in blue. R and L, Right and left persons, respectively. The type of communication behavior is indicated in black below the image.
