
Figure 6.
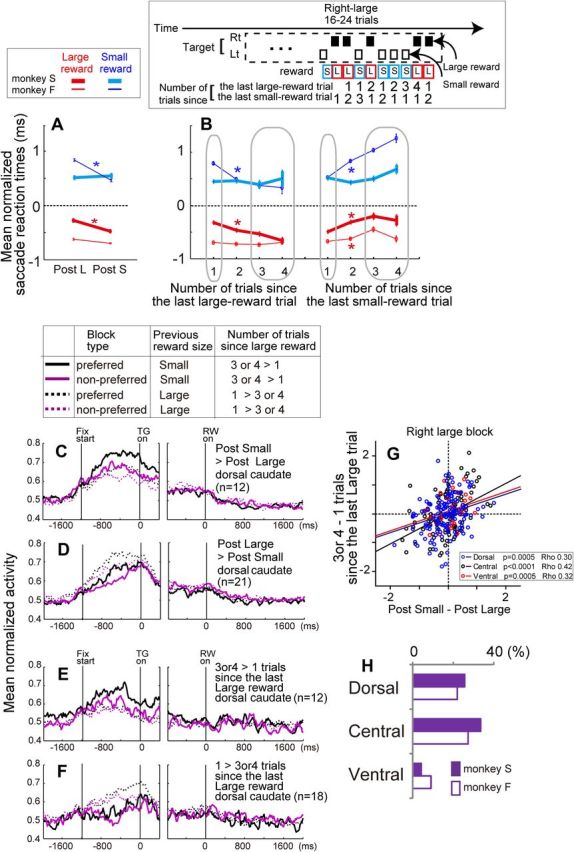
Reward history effect. A, Effect of previous reward size on the saccadic reaction times. Reaction times are normalized by the z-score, and a comparison was performed between the reaction times for current large-reward trials (red lines) preceded by large rewards (“Post L”) and small rewards (“Post S”) or reaction times for current small-reward trials (blue lines) preceded by large and small rewards. Error bars indicate SEM. *p < 0.01. B, Effect of the number of trials since the last large-reward trial (left) and the number of trials since the last small-reward trial (right) on the saccadic reaction times. An example of the measure is shown above the panel. Note that the probability that the next trial would be a large (small) reward was higher if the number of trials since the last large (small)-reward trial was larger. Statistical comparison was performed between one versus three or four trials. *p < 0.01. C, Population activity for two different reward-direction conditions with higher (preferred, black) or lower (nonpreferred, purple) block-dependent pre-target activity and with a different reward history: previous large (dashed lines) and small (solid lines). The data are from dorsal caudate neurons that showed significantly stronger pre-target activity for trials preceded by small-reward trials (p < 0.05/2, Bonferroni's correction for two reward-direction conditions). D, Same as C, except that the data are from dorsal caudate neurons with significantly stronger pre-target activity for trials preceded by large-reward trials. E, F, Same as C and D, except that the data are from dorsal caudate neurons with significantly stronger pre-target activity if the number of trials since the last large reward was large (3 or 4) or small (1), respectively. G, The difference in normalized pre-target activity between three or four versus one trial since the last large-reward trial (y-axis) was positively correlated with the difference in normalized pre-target activity between trials preceded by small versus large reward trials (x-axis). H, Percentage of neurons that showed a significant difference in pre-target activity depending on the reward size of the previous trial. Neurons that showed stronger activity when preceded by both small- and large-reward trials (for at least 1 of the 2 reward blocks) are included. Lt, Left; Rt, right; L, large; S, small.