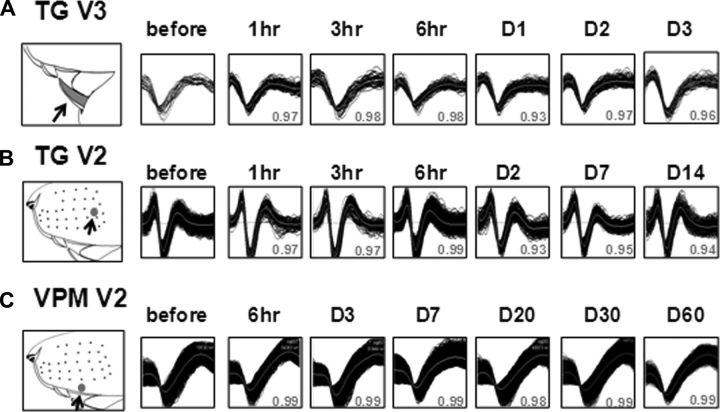
Figure 3.
Representative waveforms of stable TG (A, B) and VPM (C) units from the same microwire across days. All waveforms during the 10 min recording period on each recording session are shown. The RF of each unit is shown on the left. Stability was quantified by the maximum r value (gray numeral below each waveform), by comparing the average waveform of a given recording session with the one before IANx.

