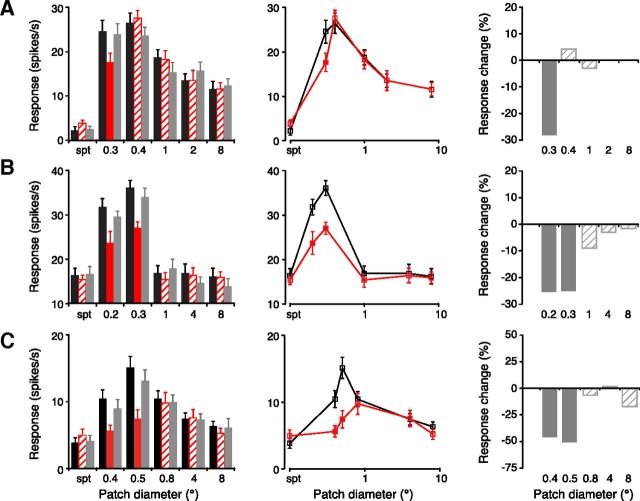
Figure 3.
Inactivation of retinotopically overlying V1 feedback reduces responses of LGN cells to smaller than optimal and optimal diameter stimuli. A–C, Three representative examples of LGN cell responses for cells whose receptive fields retinotopically overlapped the cortical inactivation site. Records show responses, plotted as both bar histograms (left) and tuning curves (middle), to gratings of varying diameter before (black), during (red), and after (gray) focal GABA inactivation in V1. Responses during V1 inactivation that differed significantly from control levels (see Materials and Methods) are marked by solid red fill (left) and filled symbols (middle). Error bars indicate SEM. Histograms to the right plot the percentage change in response during V1 inactivation, normalized with respect to control values. Significant changes, solid fill; nonsignificant changes, crosshatched. Spt, Spontaneous activity level.

