Figure 6.
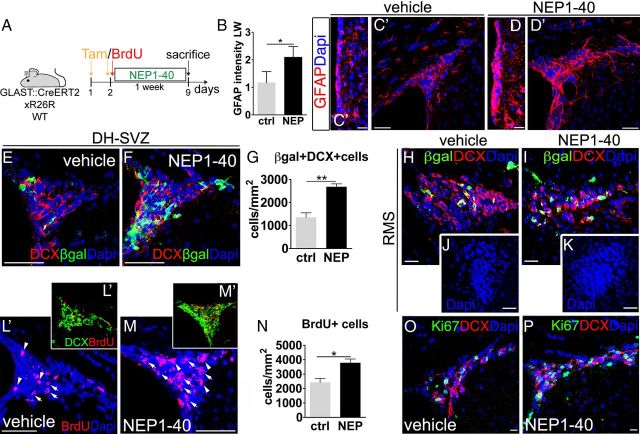
Chronic NgR1 inhibition in adult GLAST::CreErt2;R26R and wild-type mice. A, Experimental design. B, Expansion of the area along the LW labeled for GFAP after NgR1 antagonization (p = 0.022, unpaired t test, n = 8). C–D′, Anti-GFAP staining increases in the LW (D) and DH–SVZ (D′) of NEP1–40-treated animals. E, F, H, I, Micrographs depict β-gal/DCX-expressing cells in control (E, H) and NEP1–40-treated (F, I) animals at 7 d of survival. J, K, Images illustrate the RMS of control (J) and NEP1–40-treated (K) animals 10 d after starting the treatment. G, After NEP1–40 administration, the number of these cells augments in the DH–SVZ (p = 0.006, unpaired t test, n = 6). L, M, Pictures illustrate cells with strong (arrowheads) or low (arrows) BrdU staining in the DH–SVZ of vehicle-treated (L) and NEP1–40-treated (M) mice. L′, M′, BrdU+/DCX+ cells in the DH–SVZ in control (L′) and NgR1 antagonized mice (M′). N, Quantification of BrdU+ cell increase in the DH–SVZ after NgR1 antagonization (p = 0.012, unpaired t test, n = 8). O, P, Representative images of Ki67- and DCX-expressing cells in the DH–SVZ of vehicle-treated (O) and peptide-treated (P) animals. Unpaired t test: *p < 0.05, **p < 0.01. Error bars indicate SEM. Scale bars: C, C′, O, P, 20 μm; H, I, 30 μm; D, D′, 35 μm; J, K, 45 μm; E, F, L, M, 50 μm.

