
Figure 5.
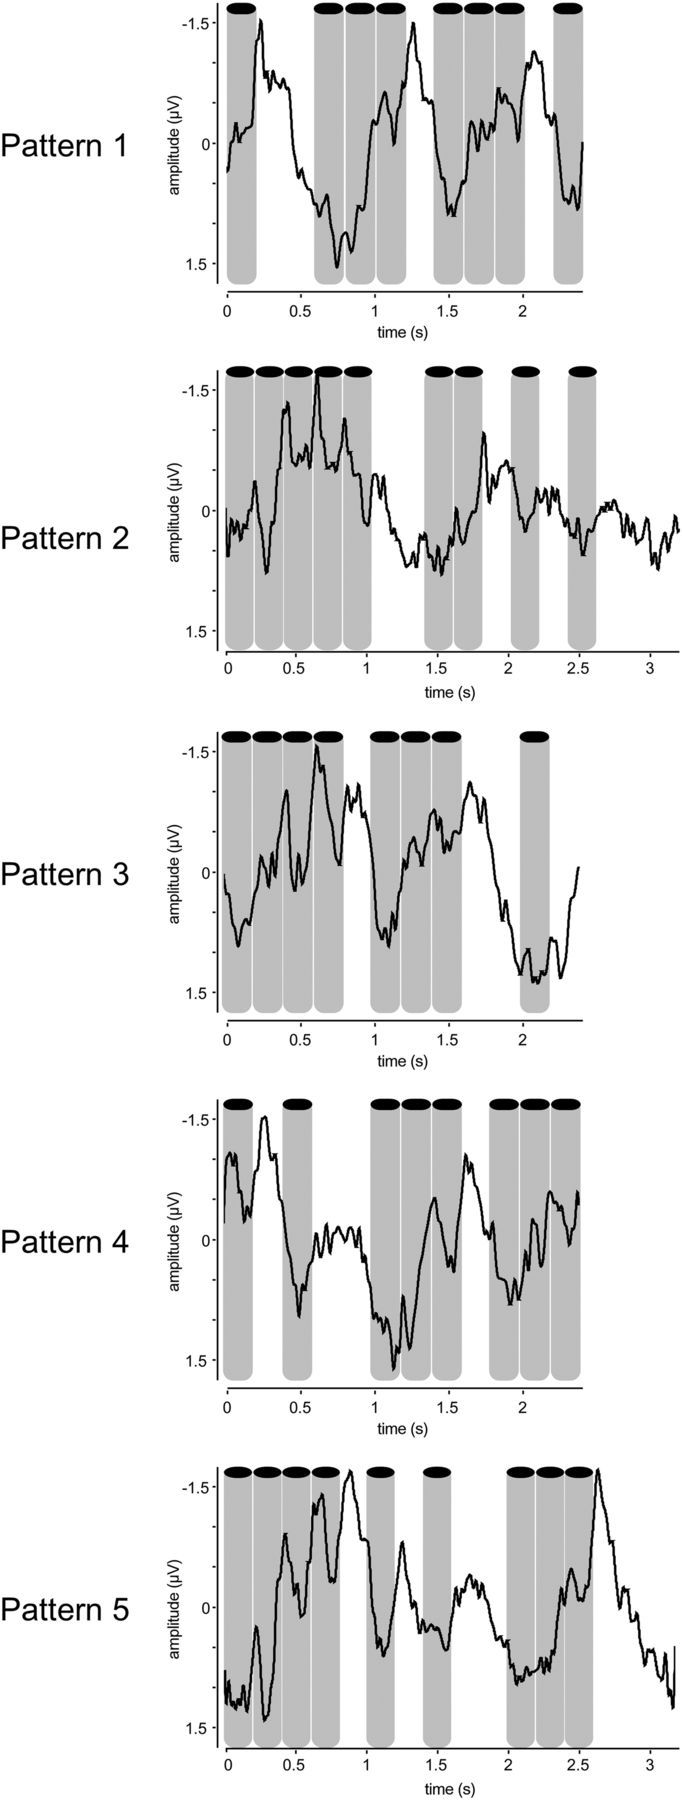
Time course of the EEG responses recorded in Experiment 1 (group-level average of the signal recorded at electrode FCz, segmented according to the length of each pattern: 2.4 s in patterns 1, 3, and 4; 3.2 s in patterns 2 and 5). The obtained signals were examined from electrode FCz, as this electrode displayed the maximum amplitude independently of the elicited signals frequencies in the EEG spectra. Some periodicity in the average signals can be observed, mostly in pattern 1, in which the 1.25 Hz frequency was predominant in the EEG spectrum. In the other patterns these periodicities are more difficult to assess in the time domain, as several frequencies were present concurrently. The sounds are represented by the gray bars.