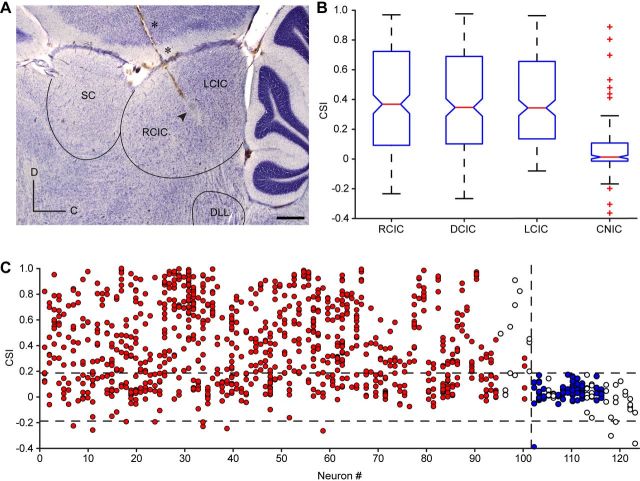
Figure 2.
Anatomical location of CSI. A, Photomicrography showing a sagittal section of the IC with a typical electrode track (asterisks) and the electrolytic lesion generated (arrowhead). Scale bar, 500 μm. C, Caudal; D, dorsal. B, Box plot with the median value (red line) of CSI sorted by anatomic regions. The blue box delimits the 25th and 75th percentiles, and dashed lines show the most extreme data points not considered outliers. Red crosses indicate outliers. Cortical regions (RCIC, DCIC, and LCIC) are significantly different from the CNIC (Kruskal–Wallis test, p < 0.001). C, Neuronal CSI variability. Each dot illustrates the level of CSI for a given pair of frequencies. Any single neuron can present levels of CSI close to 1 and below 0, depending on the region of the FRA. Red dots are values from neurons that present adapting pairs of frequencies, blue dots are values from neurons that only have nonspecifically adapting pairs of frequencies, and empty dots are pairs of frequencies in identified CNIC neurons. The top dashed line shows the higher cutoff value (0.18), the bottom one shows the lower cutoff value (−0.18), and the vertical dash line illustrates the separation between adapting and nonspecifically adapting neurons. SC, Superior colliculus; DLL, dorsal lateral lemniscus.

