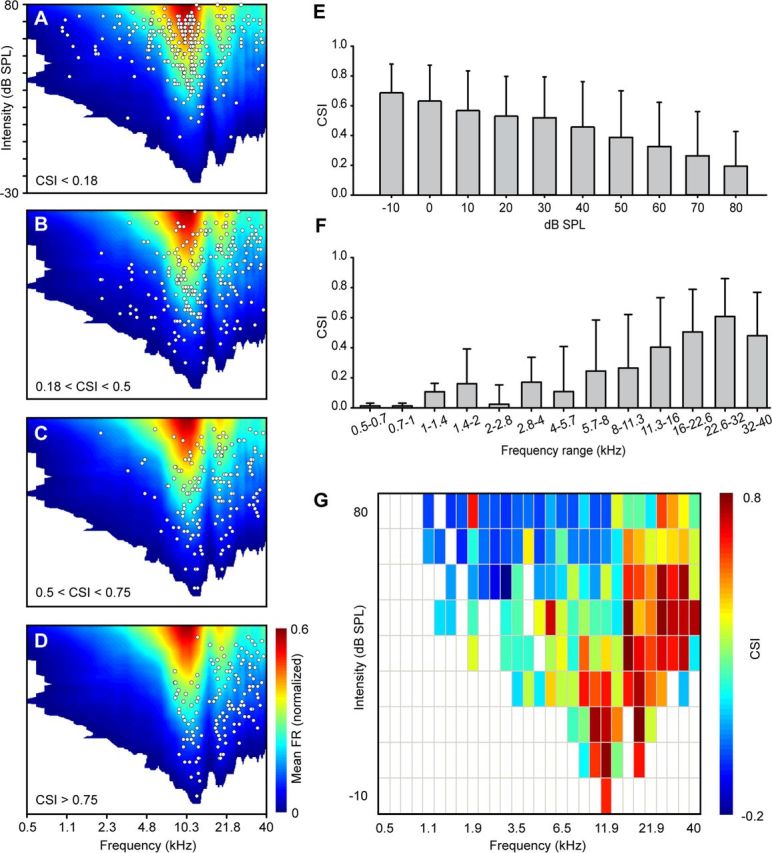
Figure 4.

Localization of the frequency pairs in the auditory receptive field sorted by CSI. A–D, Cumulative FRA generated by averaging all the FRAs in our sample. The response was normalized to the maximum firing rate of each individual neuron before pooling the FRAs. Each white dot represents the center of a pair of frequencies tested. A, Topographic location within the FRA where the lowest CSI levels (<0.18) were found. B, C, Topographic location for middle levels of CSI (0.18 to 0.5, B; 0.5 to 0.75, C). D, Topographic location of the pairs of frequencies that evoked the highest CSI levels (>0.75). E, Distribution of the levels of CSI sorted by absolute intensities (decibels of SPL). F, Distribution of the levels of CSI sorted by absolute frequencies (0.5 octaves steps, in kilohertz). G, Raw distribution of the CSI values considering absolute intensity (decibels of SPL, 10 dB steps) and frequency (in kilohertz, grouped in 0.5 octave steps). Note the different distribution of high CSI values (warm colors) and low CSI values (cold colors). Error bars indicate SD.
