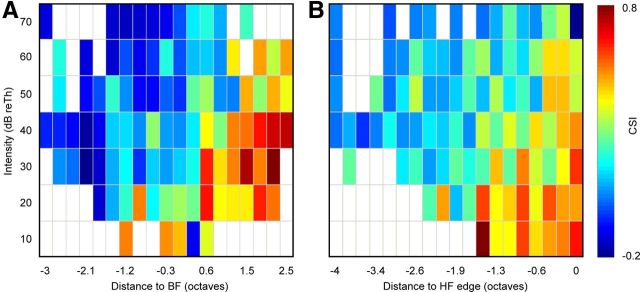
Figure 5.
Summary of the distribution of the levels of CSI in the FRA. Mean CSI values found in the neurons as a function of intensity and frequency. A, Distribution of the CSI values sorted relatively to the BF and the threshold of the FRA. High CSI values are concentrated at the high-frequency edge. B, Distribution of the CSI values relative to the high-frequency (HF) edge of the FRA for each frequency pair. The values are also standardized to the threshold of each FRA. The distribution of high CSI values along a vertical line demonstrates that there is not a bias due to high-frequency neurons.

