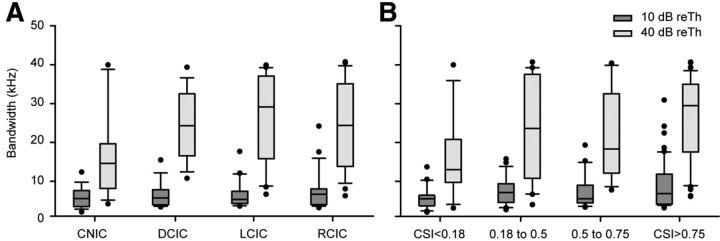
Figure 9.
Relationship between bandwidth and CSI. Box plots showing the median value of the bandwidth (in kilohertz) of the FRA at 10 dB above threshold (10 dB reTh; dark gray boxes) and 40 dB over threshold (40 dB reTh; light gray boxes) are shown. A, Median values of the bandwidth as a function of anatomical IC location. B, Median values of bandwidth sorted by the maximum level of CSI evoked in the FRA (0.18 to 0.5, CSI of <0.5; 0.5 to 0.75, CSI of <0.75; >0.75, CSI of <1). In both charts, the middle line represents the median value, the edges of the box delimit the 25th and 75th percentiles, whiskers indicate the 10th and 90th percentiles, and the dots illustrate all outliers.

