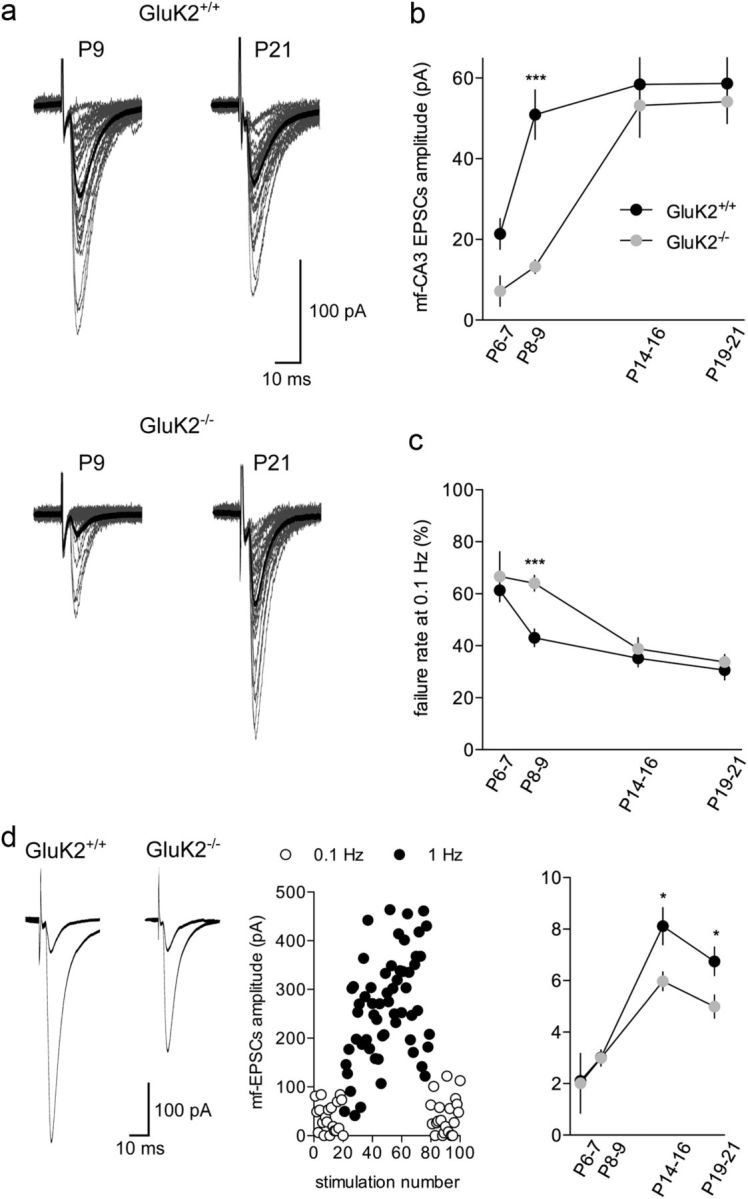
Figure 1.

The time course of functional synaptic maturation is delayed in GluK2−/− mice. a, Representative traces (30 superimposed traces in gray) recorded at 0.1 Hz in GluK2+/+ and GluK2−/− mice at P9 (left) and P21 (right). The average mf-CA3 EPSC is represented in black. b, Summary graph of the average mf-CA3 EPSCs recorded at 0.1 Hz between P6 and P21 for GluK2+/+ and GluK2−/− mice. c, Summary graph of failures at 0.1 Hz between P6 and P21 for GluK2+/+ and GluK2−/− mice. d, Average of 50 traces (left) illustrating low-frequency facilitation of mf-CA3 EPSCs when shifting frequency stimulation from 0.1 to 1 Hz for GluK2+/+ and GluK2−/− mice. Graph illustrating the time course of frequency facilitation when shifting the stimulation frequency from 0.1 to 1 Hz. Each dot represents the amplitude of a single EPSC (white dots: 0.1 Hz, black dots: 1 Hz). This example has been recorded in a GluK2+/+ mouse at P19. Summary graph of the mean frequency facilitation ratio from 0.1 to 1 Hz for GluK2+/+ and GluK2−/− mice. Mann–Whitney test: *p < 0.05; ***p < 0.001.
