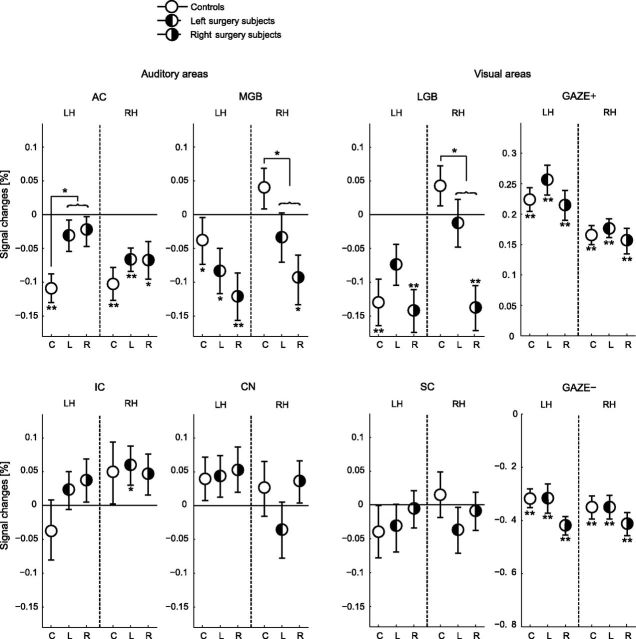
Figure 6.
ROI responses to peripheral gaze for the controls (C; n = 9) and the left surgery (L; n = 8) and right surgery (R; n = 10) tinnitus groups. In contrast to Figure 5, the left and right surgery subjects and the left and the right hemispheres are shown separately. ROI analyses were performed on unilateral AC, MGB, IC, CN, LGB, and SC, as well as the GAZE+ and GAZE−. Error bars indicate the group SEs around the mean. Statistical significances against baseline and differences between the GET group and the control group are represented by asterisks. LH, left hemisphere; RH, right hemisphere.

