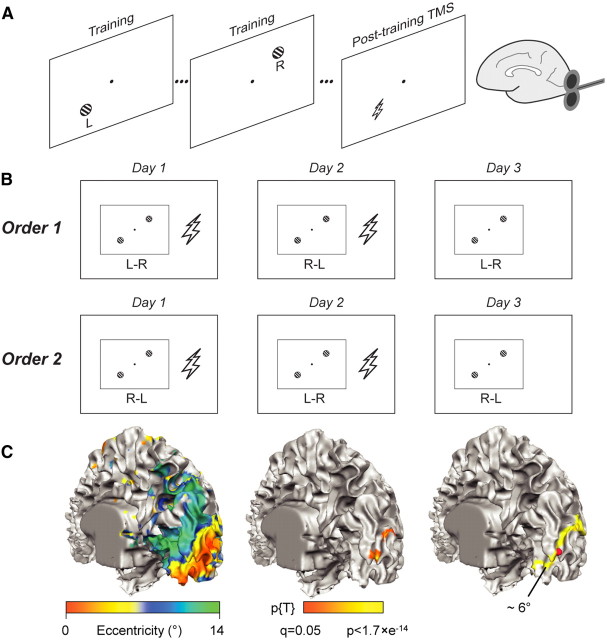
Figure 1.
Experimental design. Participants performed an orientation discrimination task on Gabor patches presented either in the lower-left or upper-right visual quadrant (A). Training sessions took place on 3 consecutive days, of which the first two sessions were followed by rTMS in the TMS group (A, B). Training regimens followed one of two possible orders (Order 1: day 1 L–R, day 2 R–L, day 3 L–R; Order 2: R–L, L–R, R–L), related to the quadrant that was trained first on a particular day. After the training session, neuronavigated rTMS was applied to the cortical representation in V1 of the L stimulus (TMS group only) (C). The cortical reconstruction of the right hemisphere of one participant is shown with the superimposed functional results of the eccentricity mapping (left), stimulus localizer (middle), and selected TMS target site (right). In the right image, the approximate localization of 6° eccentricity (yellow color) according to eccentricity mapping verifies the eccentricity of the target site. The selected TMS target site was constrained to lie within striate cortex (upper bank of the calcarine fissure).

