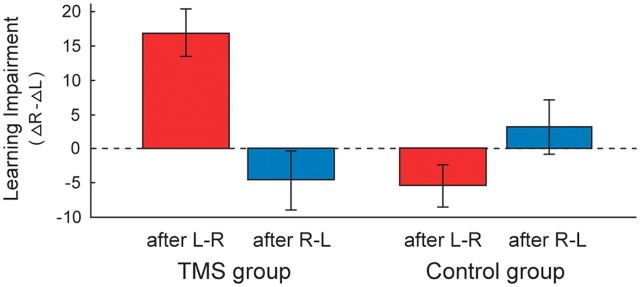
Figure 3.
Group-level TMS-induced learning impairment specific for L–R learning order. The bar graph shows a quantification of the TMS-induced learning impairment (defined as the difference between learning indices for the LT and RnT quadrant) when pooling the data across participants (TMS, n = 7; control, n = 6) according to the followed learning order (i.e., corresponding to a pooling of the red vs blue color-coded bars in Fig. 2). In the TMS group, learning is clearly impaired after L–R training (red bar), whereas TMS has no effect after R–L training (blue bar). In the control group, learning is very similar in both quadrants regardless of the followed training order. For interpretation, see Figure 4 and Discussion.

