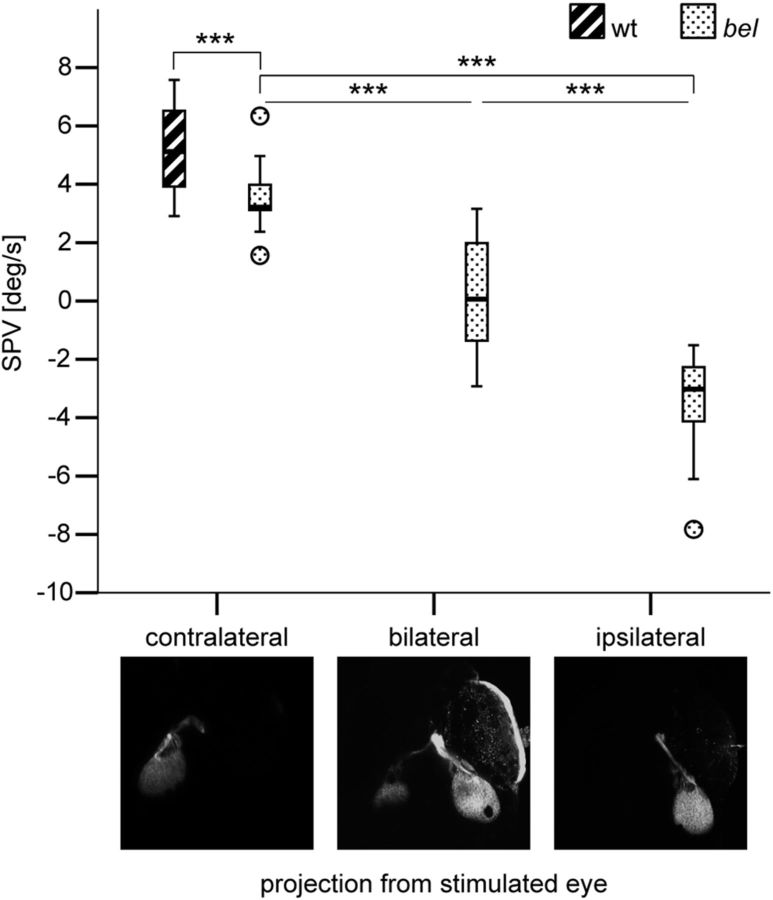
Figure 2.
OKR behavior in larvae with different optic nerve fiber projection phenotypes. Box-and-whisker plot of the SPV during monocular OKR stimulation with moving gratings (7.5 deg/s) in wt (n = 17) and in bel larvae with different projection phenotypes (n = 17 in each group). A negative SPV value represents reversal of the OKR direction. The ends of the whiskers represent the lowest data point within 1.5 interquartile range of the lower quartile and the highest data point within 1.5 interquartile range of the upper quartile. Circles represent outliers. A one-way ANOVA showed that the OKR behavior differed significantly among groups of bel larvae with different projection phenotypes (F(2,48) = 81.007, p < 0.001). Post hoc analysis using the Dunnett's T3 multiple-comparison criterion for significance indicated that the average SPV was significantly closer to 0 in bel larvae with bilateral projections (M = 0.22, SD = 1.95) than in both bel larvae with contralateral (M = 3.56, SD = 1.13) and ipsilateral (M = −3.49, SD = 1.66) projections. ***p < 0.001.

