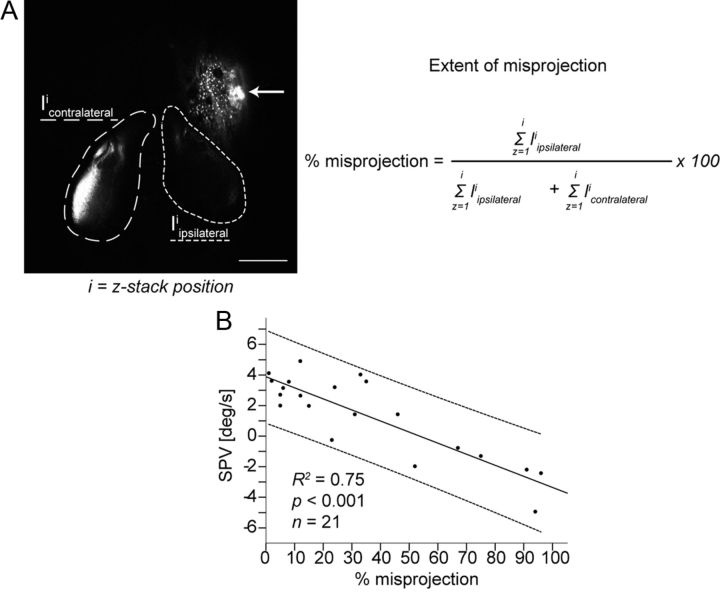
Figure 3.
Correlation between the extent of optic nerve fiber misprojection and SPV during monocular OKR stimulation with moving gratings (7.5 deg/s). A, Estimation of the extent of misprojection (percentage misprojection) after background subtraction: integrated signal intensity of the contralaterally projecting axons (Icontralateral, area marked with long dashes); integrated signal intensity of the ipsilaterally projecting axons (Iipsilateral, area marked with short dashes); and i = z-stack position. Scale bar, 100 μm. Arrow points to the injection side. B, Extent of misprojection exhibited a negative correlation with the SPV (R2 = 0.75; F(1,19) = 56.95, p < 0.001). Line of best fit and individual 95% confidence interval are shown.

