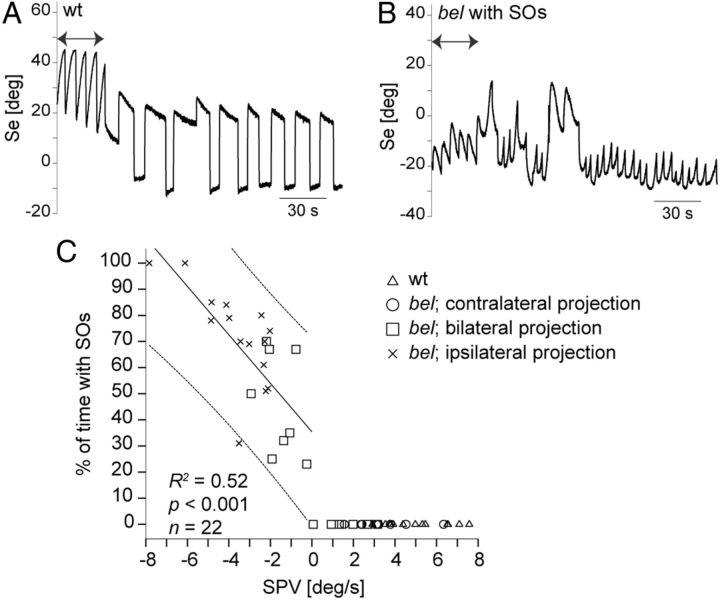
Figure 4.
Correlation between velocity of the reversed OKR and occurrence of SOs. A, B, Sample traces of eye position (Se) during stimulation with moving (7.5 deg/s) and horizontal stationary gratings. Arrows indicate a unidirectionally moving grating. The wt larva only showed saccades and slow eye drifts during presentation of stationary gratings (A). Under identical conditions, bel larvae with a reversal of the OKR displayed SOs without motion stimulus (B). C, Correlation between SPV during monocular OKR stimulation with moving gratings (7.5 deg/s) and occurrence of SOs. SOs were elicited during 5 min by stationary black and white gratings presented to the same eye that was optokinetically stimulated. Finally, the optic nerve fibers from the stimulated eye were stained (see Materials and Methods). The duration of SOs showed a positive linear correlation with the reversed OKR (R2 = 0.52; F(1,21) = 22.56, p < 0.001). Line of best fit and individual 95% confidence interval are shown. Line of best fit was only defined for SPV < 0, since larvae with SPV > 0 never displayed SOs.

