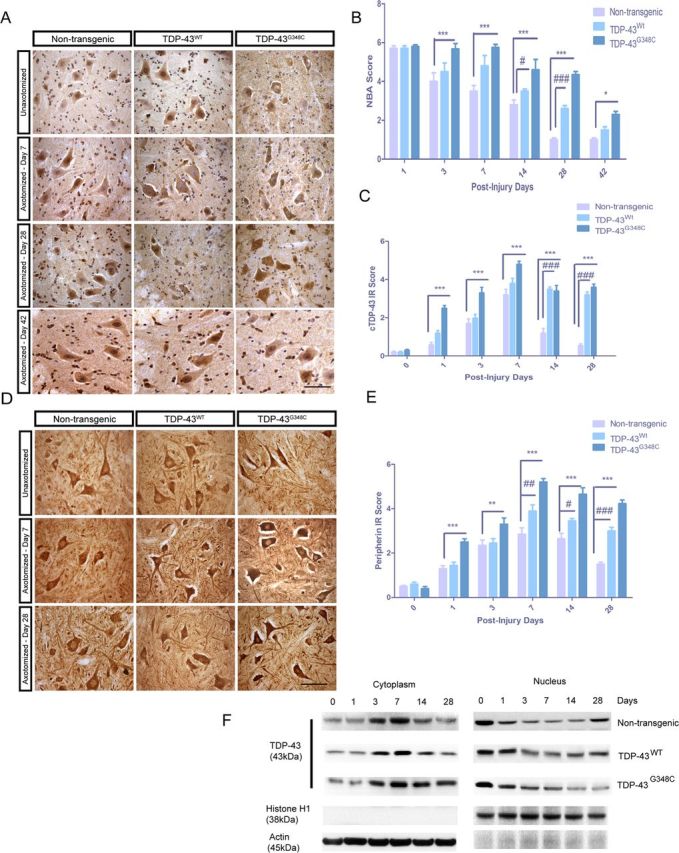
Figure 1.

NBA and quantification by IR score of cytoplasmic TDP-43 and peripherin in spinal motor neurons of mice after nerve crush. A, Representative images of immunohistochemistry on non-axotomized and axotomized (days 7, 28, and 42) spinal cord tissues using polyclonal TDP-43 antibody are shown. C, Cytoplasmic TDP-43 immunoreactivity score reveals that, in nontransgenic mice, TDP-43 was translocated in the cytosol with a peak at 7 d after nerve crush and mainly returned in the nucleus 28 d after injury. In TDP-43WT mice, the peak is also at 7 d, but cytosolic TDP-43 was still much higher than nontransgenic mice at 14 and 28 d after injury (###p < 0.001, compared with nontransgenic mice). In TDP-43G348C mice, cytosolic TDP-43 was higher on all days after nerve crush, and its mislocalization was substantially maintained at 28 d (***p < 0.001, compared with nontransgenic mice) (B). At 1 d after nerve crush, NBA scores of all the mice were comparable. TDP-43WT mice recovered slightly more slowly than nontransgenic mice, and their NBA score was significantly higher 14 d (#p < 0.05) and 28 d (###p < 0.001, n = 5, compared with nontransgenic mice) after surgery. NBA score of TDP-43G348C mice was significantly higher from 3 d after nerve crush (*p < 0.05), and they still had a severely impaired mobility at 28 d (***p < 0.001, n = 5, compared with nontransgenic mice) and 42 d (*p < 0.05). Error bar represents mean ± SEM. D, E, Representative images of immunohistochemistry on non-axotomized and axotomized (days 7 and 28) spinal cord tissues using polyclonal peripherin antibody are shown. IR scores reveal that peripherin was upregulated 7 d after injury in nontransgenic mice and decreased rapidly on 14 and 28 d after injury. In both TDP-43WT and TDP-43G348C transgenic mice, the peak IR was at 7 d but the peripherin levels were significantly upregulated 14 and 28 d after injury (**p < 0.01, ***p < 0.001, #p < 0.05, ##p < 0. 01, ###p < 0.001, compared to nontransgenic mice). Scale bars, 50 μm. n = 5 for all quantifications. Error bar represents mean ± SEM. F, Western blot analysis of the cytoplasmic and nuclear fractions from spinal cord tissues of post-axotomized nontransgenic and TDP-43 transgenic mice. In nontransgenic mice, the TDP-43 levels came back to normal levels at 28 d after axotomy. In contrast, at day 28 after axotomy, the cytoplasmic and nuclear TDP-43 levels did not return to normal levels in TDP-43G348C and TDP-43WT samples.
