Figure 3.

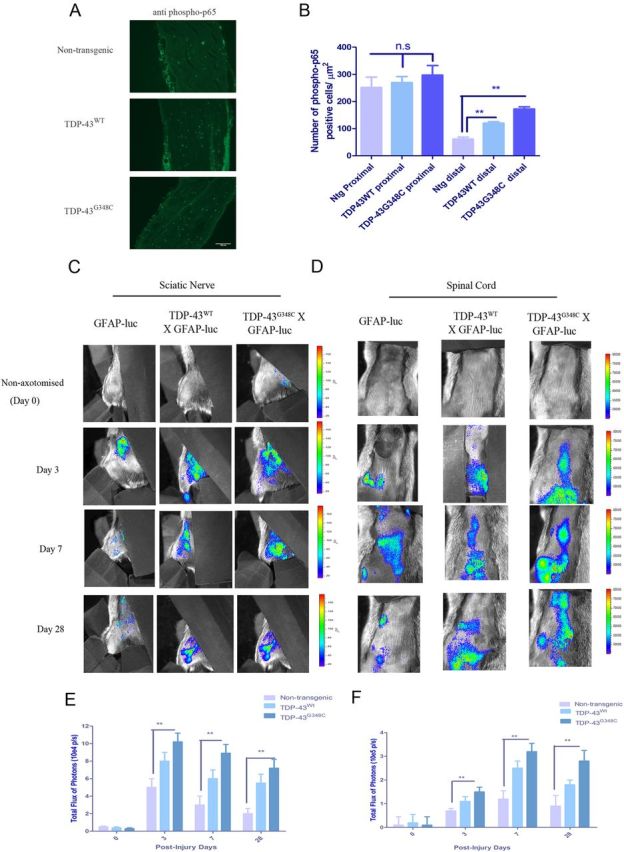
In vivo imaging revealed altered GFAP activation in double transgenic TDP-43;GFAP–luc mice after axotomy. A, Horizontal sections of sciatic nerve from nontransgenic, TDP-43WT, and TDP-43G348C mice were subjected to immunofluorescence using anti-phospho-p65 antibody. Shown are representative images distal to the axotomized site. B, Quantification showing number of phospho-p65+ cells/μm2 of distal and proximal sections of nontransgenic, TDP-43WT, and TDP-43G348C mice. C, D, GFAP–luc, TDP-43WT;GFAP–luc, and TDP-43G348C;GFAP–luc mice were imaged for GFAP promoter luciferase activity after nerve crush in sciatic nerve (C) and spinal cord (D). Representative images from in vivo imaging of sciatic nerve in non-axotomized and 3, 7, and 28 d post-axotomized mice are shown. E, F, Quantitative analysis of in vivo imaging of GFAP signal/bioluminescence (total flux of photon per second) reveals that TDP-43WT;GFAP–luc and TDP-43G348C;GFAP–luc mice have significantly higher counts in sciatic nerve (E) and spinal cord (F) than GFAP–luc controls at 3, 7, and 28 d after axotomy. Error bars represent mean ± SEM. n = 5 per group. **p < 0.01.
