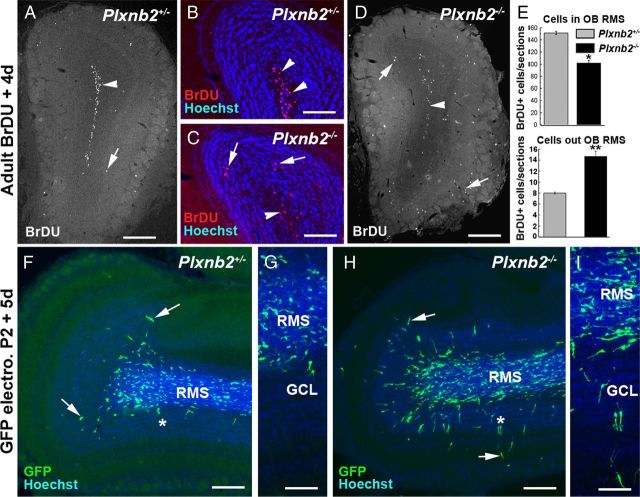
Figure 7.
Increased radial migration in the OB of Plxnb2 mutants. A–D, Coronal sections of the OB of Plxnb2+/− (A, B) and Plxnb2−/− adult mice (C, D) 4 d after an injection of BrdU. In Plxnb2+/−, almost all the BrdU+ cells are found in the RMS (A, B, arrowheads) and only a few have entered the GCL (A, arrow). By contrast, in Plxnb2−/− mutant, BrdU+ cells are found in the RMS (arrowheads) but many have entered the GC layer and PG layer (arrows). B and C are counterstained with Hoechst. E is a quantification of the distribution of BrdU+ cells inside and outside of the RMS. In the OB of Plxnb2 mutant, there is a significant increase in the number of BrdU+ cells found outside of the RMS. Error bars indicate SEM. F–I are sagittal sections of the OB of P7 Plxnb2+/− (F, G) and Plxnb2−/− (H, I) mice electroporated at P2 in the SVZ with a GFP plasmid. Whereas in Plxnb2+/− only a few GFP+ cells have started to migrate into the GCL (arrows), in Plxnb2−/− mice, many GFP+ cells have already left the RMS. G and H are higher magnification pictures of the region indicated by an asterisk in F and I (Hoechst counterstaining). Scale bars: A, D, F, H, 600 μm; B, C, G, I, 300 μm.

