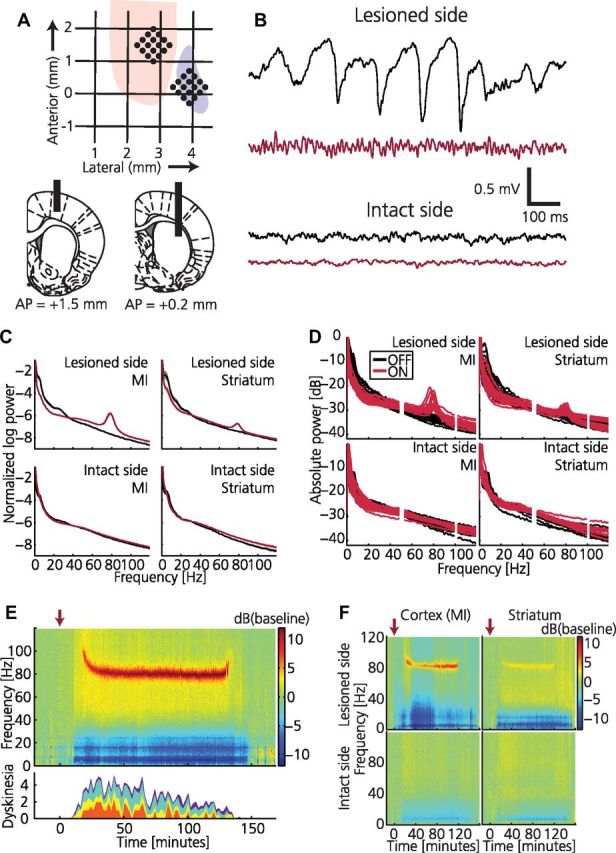
Figure 1.

Dyskinesia is associated with high-frequency oscillations in cortical local field potential. A, Schematics illustrating positioning of recording electrodes relative to bregma. Top, Horizontal plane indicating anterior and lateral positions within forelimb representation in MI (pink) and striatum (purple). Bottom, Coronal plane indicating vertical positions for cortex (left) and striatum (right) together with AP positions. Electrodes were implanted bilaterally. B, Example traces of cortical LFPs recorded synchronously from the intact and lesioned hemisphere before (black) and after (red) levodopa administration. C, Average of normalized LFP power spectra for the intact and lesioned hemisphere before (black) and after (red) levodopa administration (n = 18). D, Normalized LFP power spectra shown for each experiment (50 and 100 Hz frequencies removed due to power line noise). E, Top, Spectrogram from LFP recording in lesioned MI showing a narrowband 80 Hz oscillation associated with the dyskinetic state (power spectrum normalized to pre-levodopa baseline; red arrow, levodopa injection). Bottom, Dyskinesia score (red, rotations; yellow, limbic; turquoise, axial; purple, orolingual). F, Example of spectrograms from parallel LFP recordings in all four structures.
