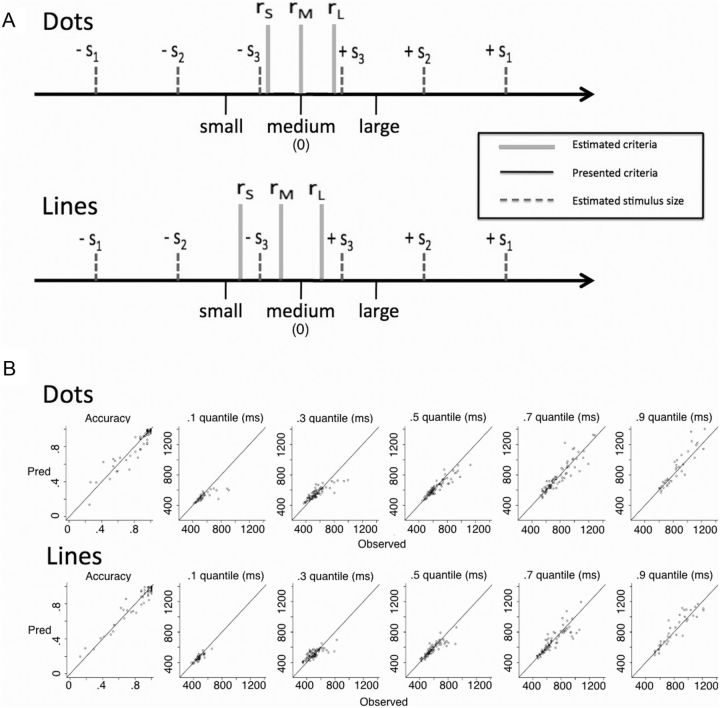
Figure 4.
DDM parameters. A, Estimated values of stimulus size (dashed gray) and criteria size (solid gray) from DDM fits are displayed (see text). The black lines represent the physical values of the criteria presented at the beginning of each block, and the gray lines represent the estimated values used by the participants. The estimated model parameters were regressed onto the objective physical sizes to show how they relate. Values of si correspond to the size of the stimulus relative to the 0 point (e.g., 50 dots in the dot trials), and values of ri correspond to the size of the perceptual criteria. The model fits show that participants effectively shifted their criteria, but did not perfectly match the physical values that were presented. B, Fit quality from the best-fitting DDM parameters is displayed. Predicted versus observed values are plotted for accuracy and the quantiles of the RT distributions. Each point indexes a participant's value for a condition and values along the diagonal show good correspondence between predicted and observed values. The plot shows that the DDM parameters captured the accuracy and RT values successfully, supporting their use in the GLM analysis.

