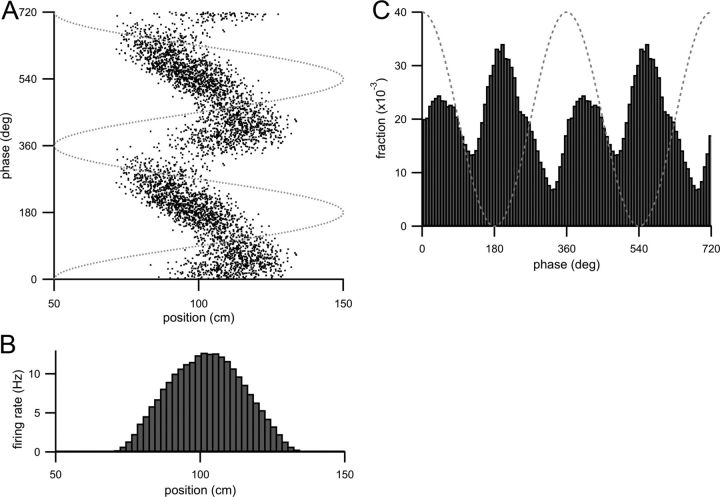
Figure 6.
Bilobed or boomerang-shaped spike raster from increasing the strength of the EC3 input component and also the theta modulation of both input components. Parameters are given in Table 1. A, Spike raster (theta phase of each action potential plotted as a function of animal position when the action potential was fired) of CA1 model cell spiking for increased EC3 input and with increased theta modulation of both input components. Dotted gray line is the theta oscillation. B, Firing rate histogram (calculated as in Fig. 1D) of model CA1 cell spiking with these parameters. C, Theta-phase histogram (fraction of spikes fired at a theta phase plotted as a function of theta phase) with these parameters. Two theta cycles are shown, and the dotted gray line is the theta oscillation.

