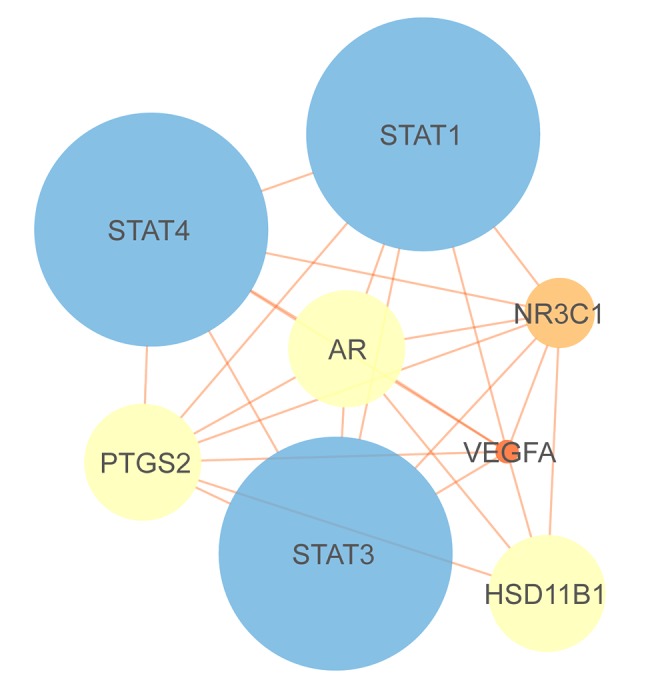
Figure 9.

Construction of the protein-protein interaction network of proteins expressed by common targets. The 8 nodes represent 8 proteins and 25 edges represent 25 pairs of interaction among proteins. The node size and color represent Degree, while edge size and color represent combined score. The data are from STRING.
