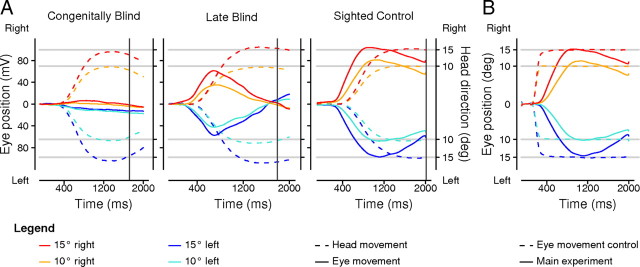
Figure 2.
A, Head traces (dashed lines) for all participants (n = 12) of the three groups and eye traces (full lines) for the congenitally blind group (left, n = 8), the late blind group with real eyes (middle, n = 7), and the sighted control group (right, n = 12) during the main experiment. Eye movements shown in head-centered coordinates are depicted in microvolts (y-axis) and head movements are represented in degrees (x-axis). Time 0 ms marks the start of the auditory signal prompting the head turn. Participants were instructed to initiate the reaching movement after their head reached the predefined head position marked by a mechanical stopper (∼1200 ms after the auditory signal). The vertical dark gray lines indicate the average time of touch for each group (CB, 1724 ms; LB, 1776 ms; SC, 2002 ms), which did neither differ statistically between head displacements nor between groups (p > 0.1). B, Eye movements of the sighted control group (n = 12) transformed into degree, shown for the main experiment (full lines) and the eye movement control condition (dashed lines). A, B, Head and/or eye traces are shown for the segmented time window of 100 ms before and up to 2000 ms after the high-pitched tone that induced the change in gaze direction or a saccade. Movement amplitudes were averaged across all trials of the four different head directions or saccade target positions (blue, 15° left; cyan, 10° left; orange, 10° right; red, 15° right). Reference lines are shown for all four head directions (light gray lines).

