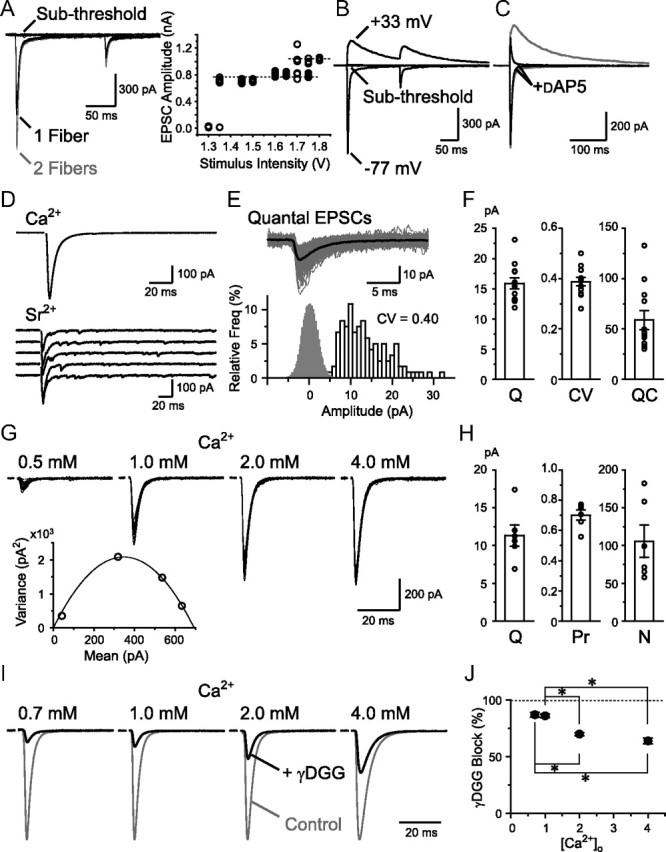
Figure 1.

Basic properties of RG synaptic transmission. A, RG–RC EPSCs recorded with varying stimulus intensities (10 traces each). EPSC amplitude plotted against the intensity on the right. B, EPSCs were recorded at −77 and +33 mV at subthreshold and overthreshold stimulus intensities. C, AMPAR current dominated at negative potentials and was isolated using d-AP5 in most of all the following experiments. D, EPSCs evoked by single RG fiber stimulation were recorded in the presence of [Ca2+]o. After substitution with [Sr2+]o to desynchronize release, qEPSCs from the stimulated fiber were measured. E, qEPSCs were aligned (gray) and averaged (black). Histograms of qEPSC amplitude and baseline noise (open and gray bars, 1 and 0.2 pA bins, respectively) are shown below. F, Summary of the average qEPSC amplitude (Q), the CV of the amplitude (CV), and the QC (n = 12). G, EPSCs in the presence of various [Ca2+]o (20 traces each are shown). The mean EPSC amplitude was plotted against the variance of the EPSC amplitudes and a parabola function was fitted as below. H, Summary of the estimates of Q, Pr, and N from the mean variance analysis (n = 6). I, Recordings with varying [Ca2+]o from four cells are shown with the EPSC amplitude normalized. Application of 2 mm γDGG produced a different amount of block depending on the Pr. J, Block by γDGG was plotted against the [Ca2+]o (n = 4–7). *p < 0.05. Error bars indicate SEM.
