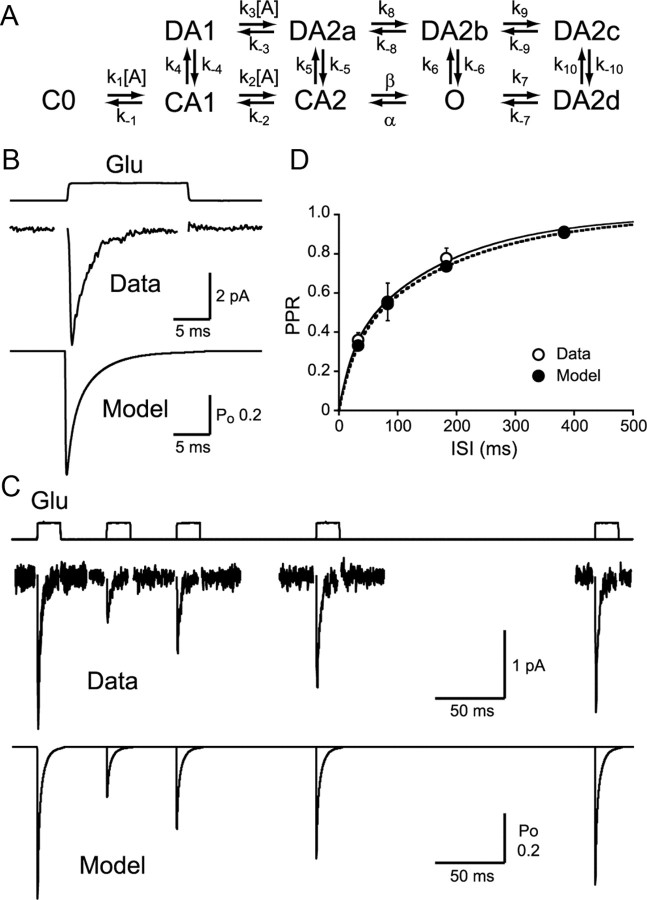
Figure 4.
Outside-out patch recordings and AMPAR kinetic model. A, Kinetic scheme of the AMPAR model. Rates were as follows (units are M−1s−1 for k1, k2, and k3, and s−1 for the rest): k1 = 13.66 × 10⁶, k−1 = 2.093 × 10³, k2 = 6.019 × 10⁶, k−2 = 4.719 × 10³, k3 = 13.66 × 10⁶, k−3 = 446.23, β = 17.23 × 10³, α = 3.734 × 10³, k4 = 1.0 × 10³, k−4 = 60, k5 = 1.8 × 10³, k−5 = 4.5, k6 = 12.36, k−6 = 1.5, k7 = 500, k−7 = 590.9, k8 = 40, k−8 = 420.9, k9 = 10.34 × 10³, k−9 = 140, k10 = 233.2, k−10 = 0.3242. B, AMPAR desensitization kinetics were studied using a 17 ms pulse of 10 mm glutamate (n = 13; Data, τfast = 0.79 ± 0.18 ms, τslow = 3.88 ± 0.86 ms, %fast = 45.0 ± 7.1, τweighted = 2.14 ± 0.29 ms; Model, τfast = 0.81 ms, τslow = 3.60 ms, %fast = 42.3, τweighted = 2.39 ms). C, Two pulses of glutamate were applied to outside-out patches separated by different intervals. Simulated responses are shown below. D, Recovery from desensitization was plotted (n = 5–10). Double exponential curve fit to the PPR recovery with rates as follows: Data, τfast = 21.9 ms, τslow = 170.5 ms, %fast = 29.9, τweighted = 126.0 ms; Model, τfast = 27.9 ms, τslow = 194.7 ms, %fast = 32.6, τweighted = 140.4 ms. *p < 0.05. Error bars indicate SEM.

