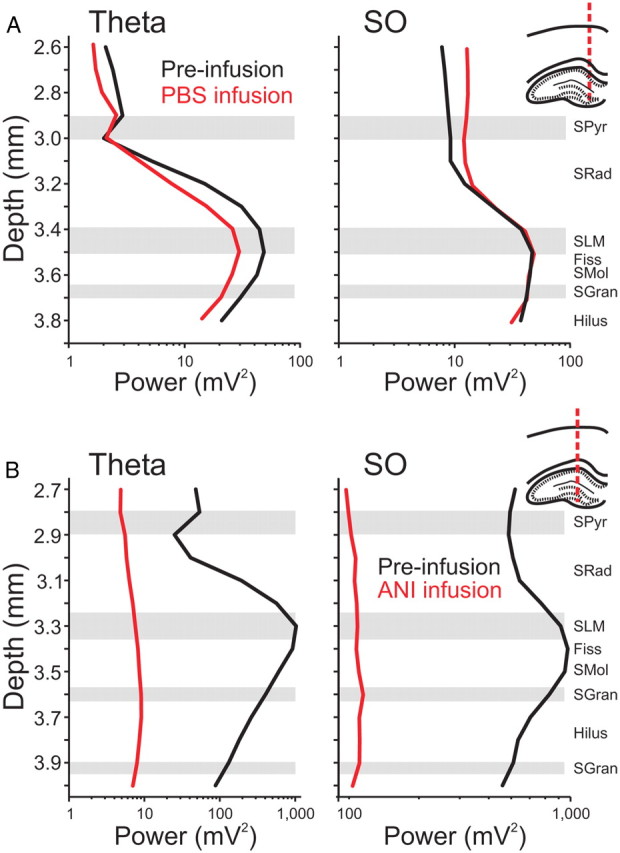
Figure 2.

Hippocampal spectral profiles are flattened by local ANI infusions. Spectral analysis was conducted on multiprobe LFP signals taken from the hippocampus at the positions indicated in the histological drawings to the right of the plots. Laminar power profiles across depth were plotted for the theta band (3–4 Hz; left panels) and the SO band (0.5–1.5 Hz; right panels) for activated and deactivated states, respectively. Representative profiles for theta and SO activity show characteristic shapes and do not change as a result of ipsilateral PBS infusions (A) but are markedly compressed following ipsilateral infusions of ANI (B). Schematic drawings indicate multiprobe tracks. The black lines indicate the profile before infusion, while the red lines represent the profiles 90 min following each respective infusion.
