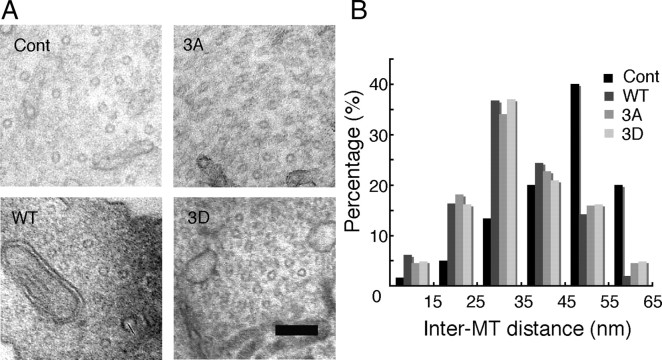
Figure 8.
The distance between MTs in PC12 cell neurites overexpressing Tau constructs. A, Cross-sectional electron micrographs of PC12 cell neurites, control (Cont) or overexpressing Tau WT, 3A, or 3D. Scale bar, 100 nm. B, Inter-MT distances were measured between nearest-neighbor MTs and expressed as the percentage of the total number of counts. The mean distance was 45.1 ± 2.2 (n = 54) for control PC12 cells and 33.1 ± 2.4 nm (n = 49), 34.1 ± 2.6 nm (n = 44), and 34.19 ± 2.8 nm (n = 62) for PC12 cells overexpressing Tau WT, 3A, and 3D, respectively.

