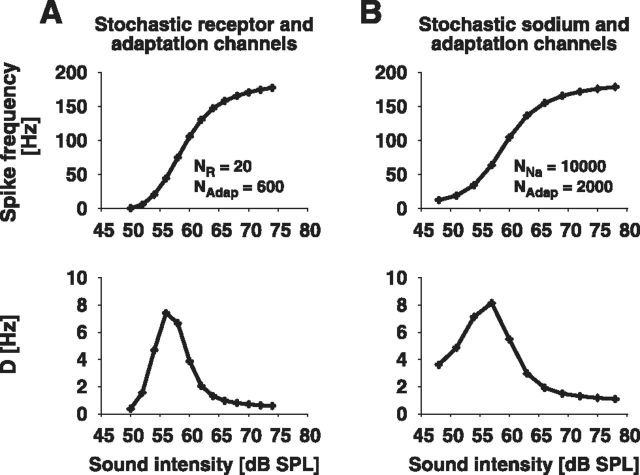
Figure 10.
ISI statistics of the mixed stochastic-channel models. Shown are the spike frequency (top) and the diffusion coefficient D (bottom) as a function of sound intensity of the model with both stochastic adaptation channels and either (A) stochastic receptor channels or (B) stochastic sodium channels.

