Figure 3.

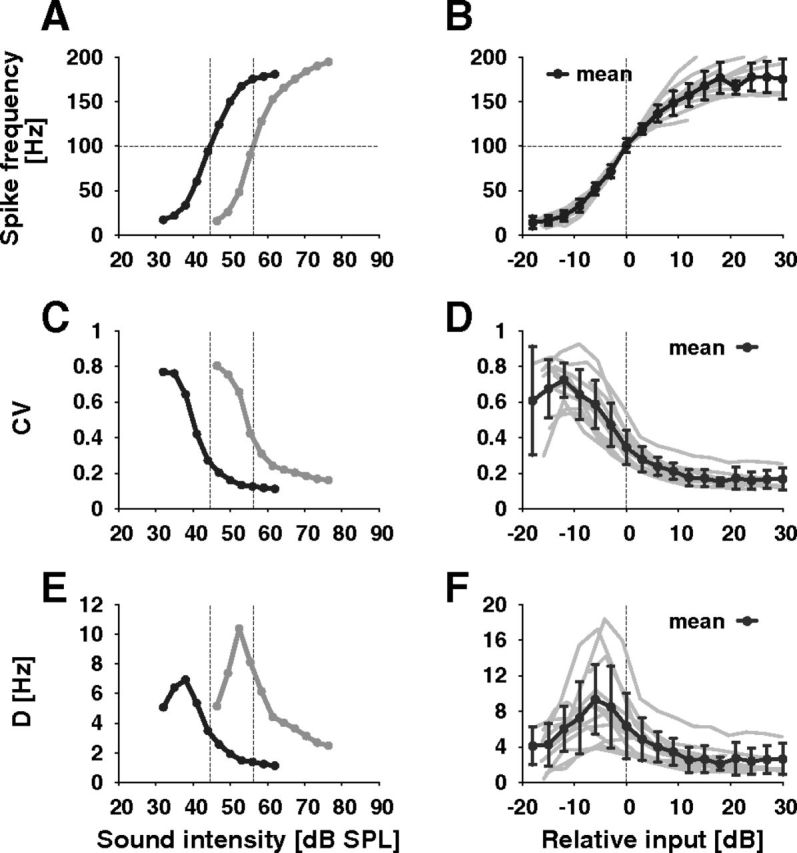
Response characteristics of auditory receptor neurons. A, The rate-level functions (steady-state f-I curve) of two different auditory receptor neurons have a similar sigmoidal shape, but differ in their sensitivity. B, Rate-level functions of 12 different cells (gray lines) including the ones shown in A shifted along the intensity axis such that they align at a spike frequency of 100 Hz. The black line is the average ± SD over all cells, as also in D and F. C, Coefficient of variation (CV) as a function of sound intensity for the two cells shown in A and D, aligned for 12 neurons (as in B). The CVs tend to decrease over the cell's dynamic range. E, The diffusion coefficient D (see Materials and Methods, Data analysis) as a function of sound intensity for the two cells shown in A and F, aligned (as in B). The curves show a pronounced peak in the lower part of the cells' dynamic range.
