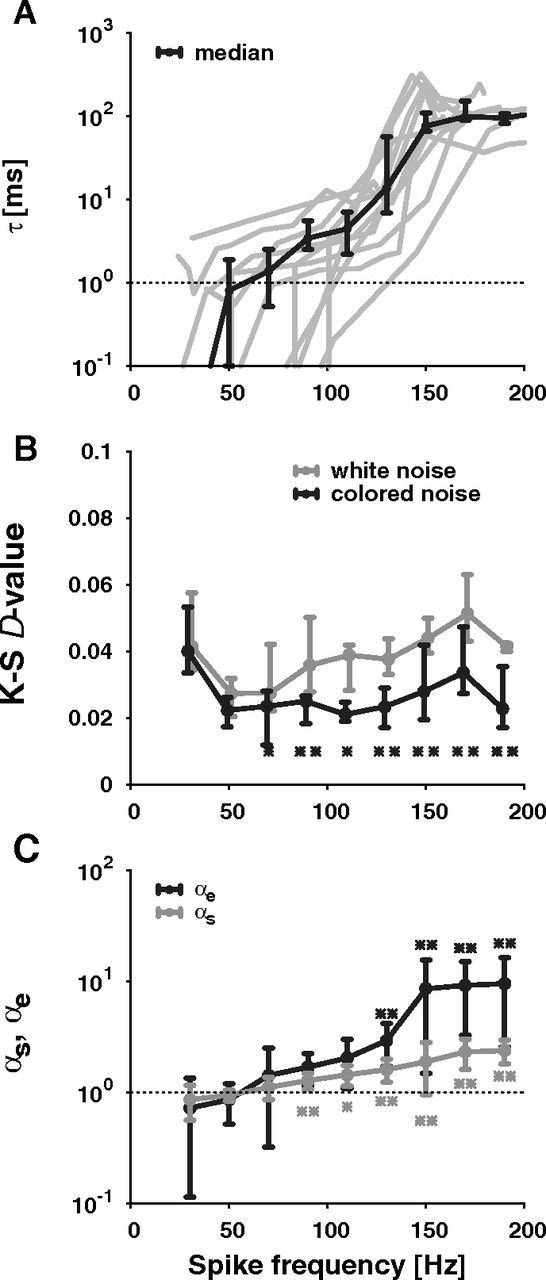
Figure 5.

Parameter quantifying the shape of ISI histograms. Shown are data pooled from 12 auditory receptor cells as a function of spike frequency (stimulus duration: 500 ms) A, Correlation time constants τ determined by fitting the colored-noise ISI density equation (2) to the data for each of the 12 recorded receptor neurons (gray lines) and the overall mean ± SE (black line). B, The goodness of the fits quantified by the D values of K-S tests, i.e., the maximum difference between the cumulative distribution of the ISIs and the cumulative distributions of the colored-noise (black line; Eq. 2) or white-noise ISI densities (gray line; Eq. 1), respectively (median quartiles). The asterisks mark spike-frequency bins where the K-S D values of the colored-noise densities are significantly lower than the K-S D values of the white noise densities (Wilcoxon test, **p < 0.01, *p < 0.05). C, The mean ± SD of the rescaled skewness (αs, gray line; Eq. 4) and kurtosis (αe, black line; Eq. 5) of the ISI histograms indicating the heaviness of the tail and the peakedness. The asterisks label the data points (αs, gray stars; αe, black stars), which are significantly different from unity (Sign test, **p < 0.01, *p < 0.05).
