Figure 6.
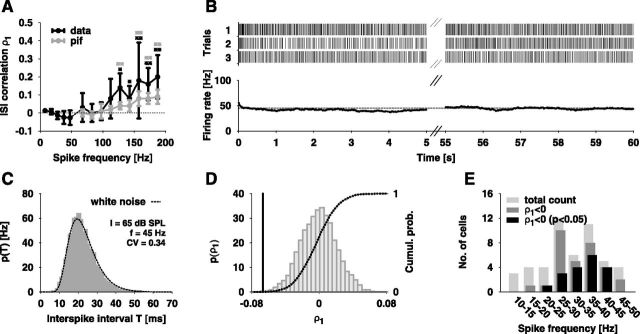
Correlations between successive ISIs. A, Measured serial correlation coefficient ρ1 ± SD (black lines) as a function of spike frequency f. The coefficients for f ≤ 50 Hz are averages from 14 cells (stimulus duration 1 min) while those for f > 50 Hz are averages from 12 cells (stimulus duration 500 ms). The gray line shows the ISI correlations arising solely from the slight decrease of the spike frequency during the stimulus as computed from a PIF model (see text for details). The black asterisks label the data points, which are significantly different from zero (Sign test, **p < 0.01, *p < 0.05). The gray asterisks indicate the data points for which the ISI correlations of the experimental data and of the PIF model are significantly different (Wilcoxon test, **p < 0.01). B, Top, Spike trains recorded intracellularly during stimulation with a 1 min pure tone of 65 dB SPL and 6 kHz. Bottom, The mean firing rate (average number of spikes per 500 ms time window) stays constant over time. C, Comparison of the white noise distribution pwn (dashed line; Eq. 1) with the ISI histogram (gray boxes) obtained from the data shown in B. D, The distribution of ISI correlations after shuffling ISIs (bars), the corresponding cumulative histogram (dashed line) and the measured ρ1 (solid line) for the data shown in B. E, Number of cells with and without significantly negative ρ1 (p < 0.05) as a function of spike frequency.

