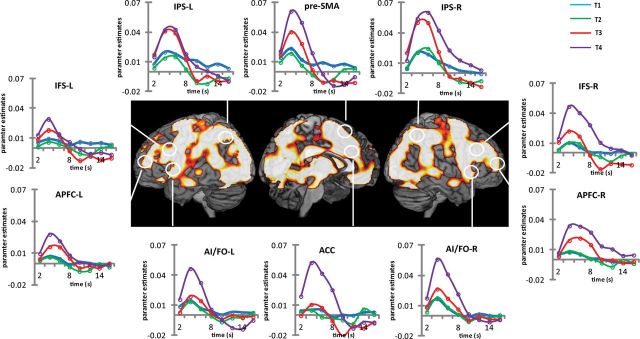
Figure 2.
Experiment 1. The whole brain render shows areas where target detection significantly modulated brain activity (ANOVA comparing the first 5 FIR regressors after each target detection event; results thresholded at family-wise error corrected p < 0.05). For ROIs, estimates of eight FIR regressors linked to each target event were extracted and plotted to construct the time course of BOLD activity (blue, T1; green, T2; red, T3; purple, X). L, Left; R, right.

