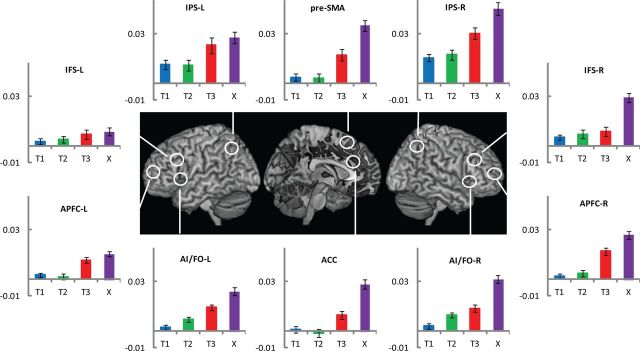
Figure 3.
Experiment 1. Comparison of phasic activity in response to various target events. Plots show activity index for each target. This was derived for each target event by subtracting the estimate of the first FIR regressor from the average of the second and third. The error bars represent one standard error of the mean.

