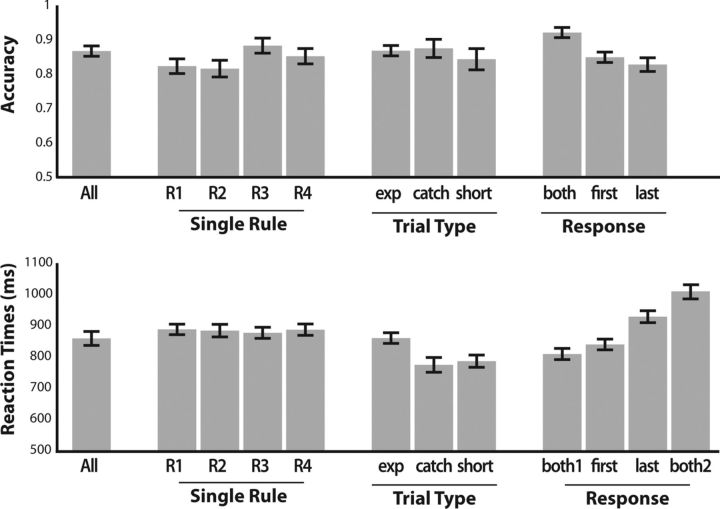
Figure 3.
Plot of the average response accuracy (top) and average reaction times (bottom) in different trials. All: average across all trial types. R1–R4: single rule 1–4. Exp: experimental trials. Catch: catch trials. Short: catch trials with short delay (2 s). Both: trials requiring a response involving both A and B (i.e. AB or BA). First: trials in which the response should be derived from the rule to be evaluated first. Last: trials in which the response should be derived from the rule to be evaluated last. Both1, Both2, reaction times to the first and second response, respectively, when two responses are due. Error bars display SEM.

