
Figure 4.
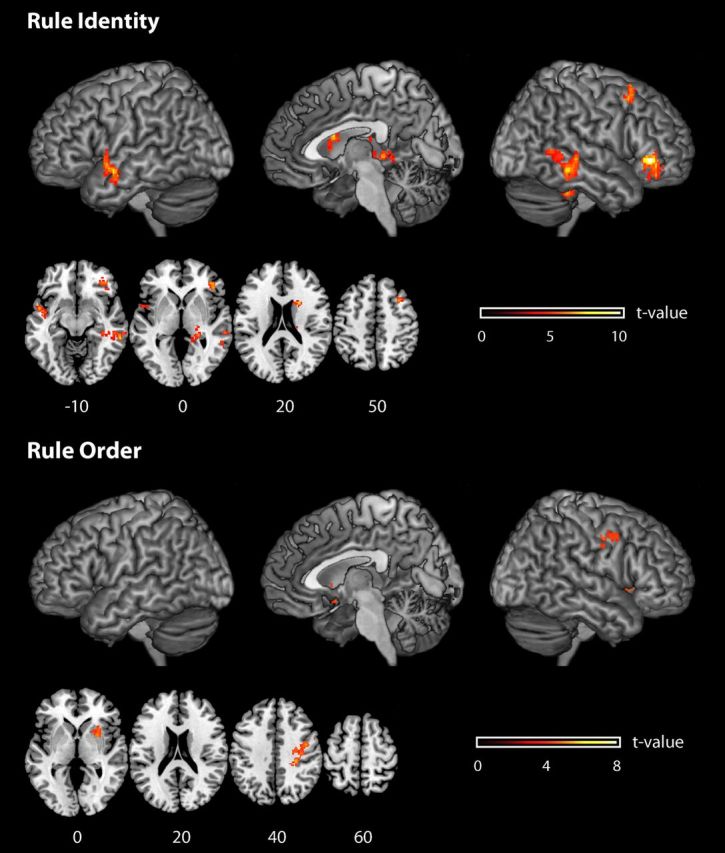
Brain regions from whole-brain analyses where it was possible to decode from local patterns of activation the identity of the active rule set (top), and the rule order (bottom). Informative brain regions are rendered onto a T1-weighted brain image. The reported effects are all significant at p < 0.05, corrected for multiple comparisons. Color scales (t values) are reported separately for each plot.