
Figure 2.
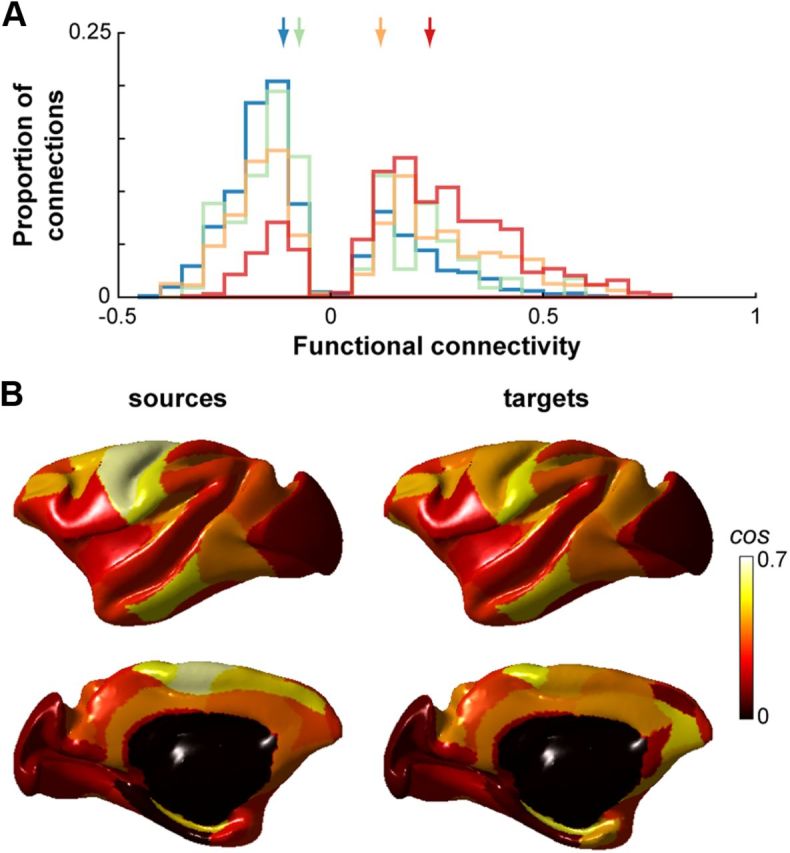
FC varies with anatomical connectivity. A, Distributions of FC strengths for region pairs with no direct anatomical connections (blue) and weak (green), moderate (orange), and strong (red) anatomical connections. Colored arrows indicate the medians of the corresponding distributions (no direct anatomical connection, −0.126; weak −0.090; moderate, 0.092; strong, 0.201). Only reliable coefficients as determined by a bootstrapping procedure are shown. B, Cosine similarity between functional and structural connectivity for each cortical region of the left hemisphere projected onto the F99 surface. Values are displayed for regions as sources and targets separately. Right hemisphere cosine similarities were similar (data not shown).