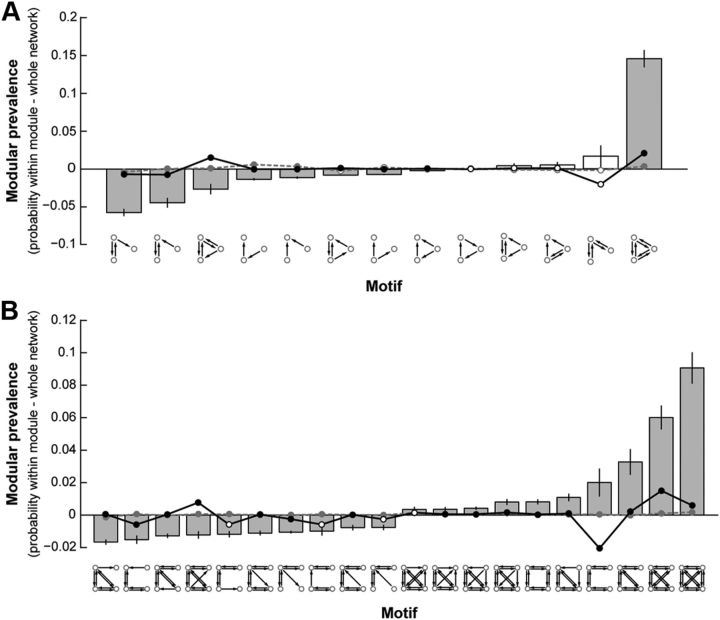
Figure 5.
Modular prevalence of motif classes with three (A) and four (B) nodes. Average ± SEM difference between the probability of motif occurrence within module and across the whole network. Filled bars represent significant differences from 0 (t test, p < 0.001). Circular data points represent the average ± SEM modular prevalence of motif classes for 1000 null models with fixed-degree (gray dashed line) and fixed-connection length (black solid line) distributions. Filled circles represent significant differences from the observed in at least 75% of null models (t tests, p < 0.05). In B, only the top 10 most and least prevalent motif classes are shown.

